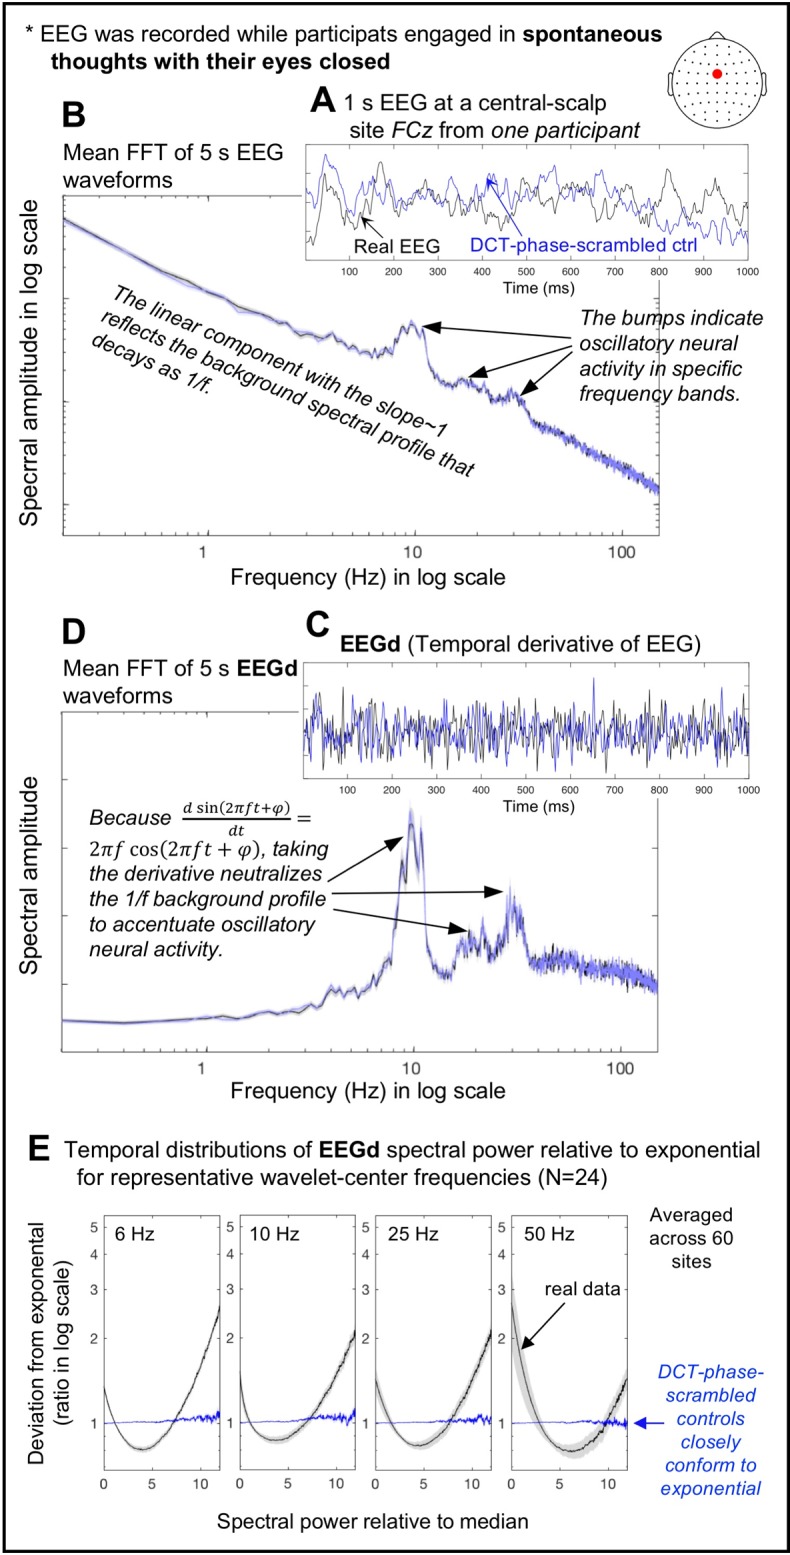
Fig 1. The use of the temporal derivative of EEG, EEGd, and DCT-phase-scrambled controls for examining intrinsic cross-frequency spectral-power associations.

A. An example of a 1 s EEG waveform (black) and its DCT-phase-scrambled control (blue) at FCz from one participant. B. Mean fast Fourier transforms (FFTs) computed on the fifty-nine 5 s waveforms (same site and participant) for the real EEG (black) and its DCT-phase-scrambled control (blue) plotted in a log-log format. C. The temporal derivatives, which we call EEGd, of the example EEG waveform (black) and its DCT-phase-scrambled control (blue) shown in A. D. Mean FFTs computed on the fifty-nine 5 s waveforms (same site and participant) for the real EEGd (black) and its DCT-phase-scrambled control (blue) plotted in a semi-log format. For B and D, the shaded regions represent ±1 standard error of the mean based on the FFTs computed on multiple 5 s waveforms. E. Temporal distributions of EEGd spectral power for representative wavelet-center frequencies (6, 10, 25, and 50 Hz) for the real data (black) and their DCT-phase-scrambled controls (blue), plotted as deviations from exponential fits to the DCT-phase-scrambled controls (averaged across all sites). The deviations are shown as ratios in log scale, and spectral power (x-axis) has been normalized to the median (per frequency per site per participant). The shaded regions represent ±1 standard error of the mean with participants as the random effect. Note that the DCT-phase-scrambled data provide suitable stochastic controls because their exponential spectral-power distributions imply a Poisson point process.
