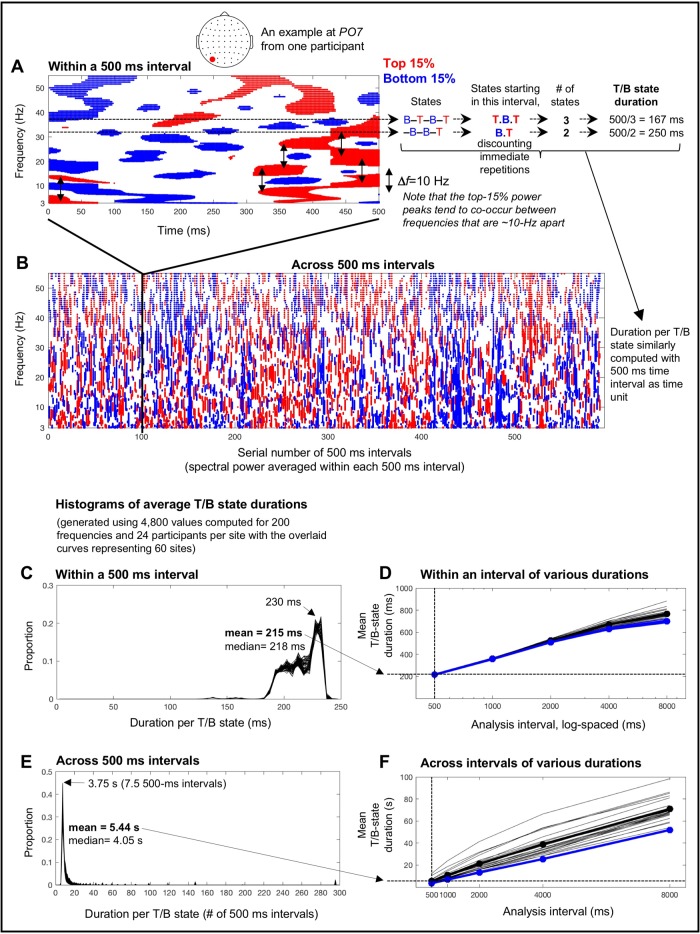
Fig 2. Intrinsic spectral-power variations on the characteristic sub-second (~230 ms) and seconds (~3.75 s) timescales.
A. An example of the top-15% (red) and bottom-15% (blue) spectral-power variations within a 500 ms interval (taken from a 5 min EEG recording; see B) at a posterior site, PO7, from one participant. Note that spectral power tends to peak in pairs of frequencies that are ~10 Hz apart (the vertical arrows indicating Δf~ 10 Hz). The average duration of the top and bottom states was estimated per frequency by identifying the state sequence (“B” for bottom, “T” for top, and “–” for in-between states in the illustration), counting the top and bottom states that started within the interval while discounting immediate repetitions, and dividing the interval duration (500 ms in this case) by the number of T/B states. Two examples are shown for two different frequencies (see text for details). The average T/B-state duration computed for each of the six-hundred 500 ms intervals over the 5 min EEG recording period were averaged per frequency per participant per site. B. An example of the top-15% (red) and bottom-15% (blue) power variations occurring across 500 ms intervals (spectral power averaged within each 500 ms interval) over the 5 min period. The average duration of the top and bottom states was estimated in the same way as for the 500 ms interval (see A) but using 500 ms intervals as time unit. C. Histograms of average within-500-ms-interval T/B-state durations (averaged across 600 intervals) based on the 4,800 values computed for 200 wavelet-center frequencies and 24 participants per site; histograms from the 60 sites are overlaid. The mode of ~230 ms with the mean of ~215 ms indicate that each brief high/low-power state typically lasted about a quarter of a second. D. Mean within-interval T/B-state durations similarly computed using different analysis intervals, 1000, 2000, 4000, and 8000 ms in addition to 500 ms, for both the real (black) and phase-scrambled (blue) data (the thin lines showing individual participants’ data). The mean within-interval T/B-state duration approximately logarithmically increased with the length of analysis intervals. Note that the real and phase-scrambled curves virtually overlap, indicating that within-interval T/B-state durations depend primarily on spectral-amplitude compositions regardless of phase relations. Also note that individual differences are negligible for within-interval T/B-state durations computed with short (< 1000 ms) analysis intervals. E. Histograms of average across-500-ms-interval T/B-state durations based on the 4,800 values computed for 200 wavelet-center frequencies and 24 participants per site; histograms from the 60 sites are overlaid. The mode of ~3.75 s and the mean of 5.44 s indicate that each longer high/low-power state typically lasted several seconds. F. Mean across-interval T/B-state durations similarly computed using different analysis intervals (1000, 2000, 4000, and 8000 ms in addition to 500 ms) for both the real (black) and phase-scrambled (blue) data (the thin lines showing individual participants’ data). The mean across-interval T/B-state duration approximately linearly increased with the length of analysis intervals. Note that the real and phase-scrambled curves nearly overlap for the 500 ms interval, indicating that T/B-state durations measured across 500 ms intervals primarily depend on spectral-amplitude compositions regardless of phase relations. Also note that individual differences are small for across-interval T/B-state durations computed with short (< 1000 ms) analysis intervals. We chose 500 ms as the analysis interval because it revealed the sub-second (within-interval) and seconds (across-interval) timescales of spectral-power fluctuations (1) that were relatively stable, depending on spectral-amplitude compositions regardless of phase relations, (2) that were highly consistent across participants, and (3) that appeared to support maximally distinct patterns of fast and slow spectral-power associations (see text for details).

