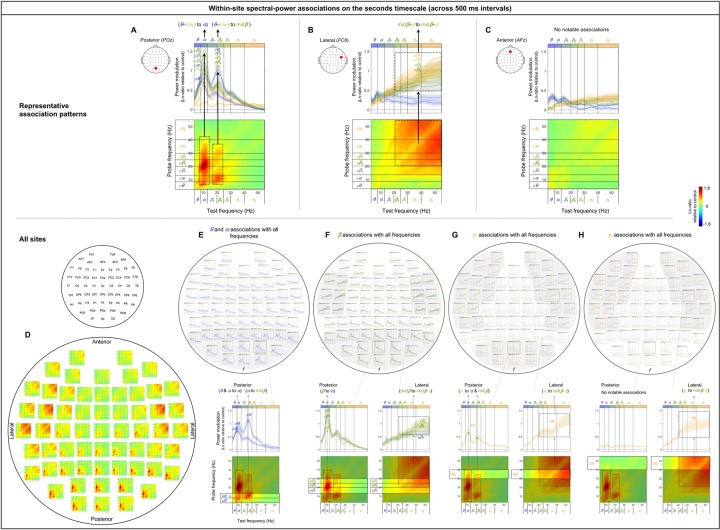
Fig 4. Within-site spectral-power associations on the seconds timescale (across 500 ms intervals).
The seconds-timescale spectral-power associations were computed at 500 ms temporal resolution across the entire 5 min period (per site per participant) and averaged across participants. Each 2D-association plot shows the strengths of the same-signed (positive values, warmer colors) or opposite-signed (negative values, cooler colors) power modulation at all test frequencies (x-axis) that temporally coincided with the top/bottom-15% power variation at each probe frequency (y-axis), computed as Ln-ratio relative to the DCT-phase-scrambled control (to remove artifacts due to partial wavelet overlap; see text for details). Any asymmetry across the diagonal indicates directional differences; X-Hz power modulation coincident with the top/bottom-15% Y-Hz power variation may be stronger/weaker than the Y-Hz power modulation coincident with the top/bottom-15% X-Hz power variation. A-C. Representative association patterns. The strong positive associations along the vertical and horizontal directions indicate that spectral-power associations are characterized by multiple frequencies being associated with a specific frequency band or with one another. The accompanying line plots show the association strengths of each probe-frequency band (labeled with “p”; warmer-colored curves representing higher-probe-frequency bands) with all test frequencies (x-axis). The plots clearly show that the association strengths peaked at specific test frequencies. A. An example from a representative posterior site (POz) characterized by the associations of the θ-lowγ frequencies with the α band and to a lesser degree with the midβ band (dashed rectangles), suggesting that the α band and to a lesser degree the midβ band play a role in coordinating cross-frequency interactions at posterior sites. B. An example from a representative lateral site (FC6) characterized by the broad associations among the midβ-γ frequencies (dashed square). C. An example from a representative anterior site (AFz) characterized by the lack of notable associations, suggesting that different frequency bands operate relatively independently at anterior sites. D-H. Association patterns at all sites. D. 2D-association plots. E-H. Corresponding line plots showing the association strengths of each probe-frequency band with all test frequencies (x-axis). The line plots are shown separately for the θ-α (E), β (β1, β2, β3) (F), γ1 (G), and γ2 (H) bands to reduce clutter. The lower panels show representative 2D-association plots to highlight the specific probe-frequency bands included in the line plots. E. Line plots showing the association strengths of the θ and α probe-frequency bands (labeled “pθ” and “pα”) with all test frequencies. The θ and α bands are both associated with the α band while the α band is additionally associated with the midβ band at posterior sites (especially in the region shaded in gray). F. Line plots showing the association strengths of the β (β1, β2, β3) probe-frequency bands (labeled “pβ1,” “pβ3,” and “pβ3”) with all test frequencies. The β (β1, β2, β3) bands are primarily associated with the α band at posterior sites, while the β2 and β3 bands are broadly associated with the midβ-γ bands at lateral sites (especially in the regions shaded in gray). G. Line plots showing the association strengths of the γ1 probe-frequency band (labeled “pγ1”) with all test frequencies. The γ1 band is associated with the α and midβ bands at posterior sites, while it is broadly associated with the midβ-γ bands at lateral sites (especially in the regions shaded in gray). H. Line plots showing the association strengths of the γ2 probe-band (labeled “pγ2”) with all test-frequency bands. The γ2 band is broadly associated with the midβ-γ bands at lateral sites (especially in the regions shaded in gray). In all parts the shading on the line plots represents ±1 standard error of the mean with participants as the random effect.

