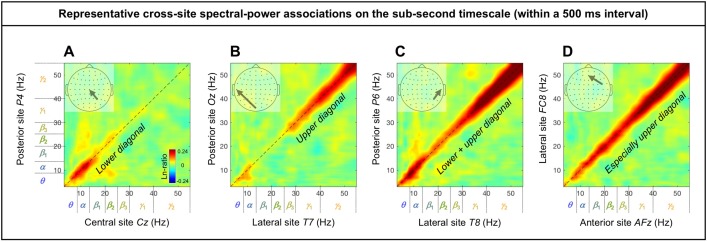
Fig 5. Representative examples of cross-site spectral-power associations on the sub-second timescale (within a 500 ms interval).
Each 2D spectral-power-association plot shows the strengths of the same-signed (positive values, warmer colors) or opposite-signed (negative values, cooler colors) power modulation (in Ln-ratio) for all test-site frequencies (x-axis) that temporally coincided with the top/bottom-15% power variation at each probe-site frequency (y-axis). The sub-second-timescale spectral-power associations were computed at 512 Hz temporal resolution within each 500 ms interval, averaged across all intervals and then across participants. The associations (all positive) were characteristically diagonal, indicative of within-frequency associations, while the ranges of associated frequencies varied from site-pair to site-pair. A. Within-frequency associations in the lower diagonal involving the θ-lowβ frequencies from a posterior site P4 to a central site Cz. B. Within-frequency associations in the upper diagonal involving the γ frequencies from a posterior site Oz to a lateral site T7. C. Within-frequency associations in the lower and upper diagonal involving the θ-α and γ frequencies from a posterior site P6 to a lateral site T8. D. Stronger within-frequency associations in the higher frequencies from a lateral site FC8 to an anterior site AFz.

