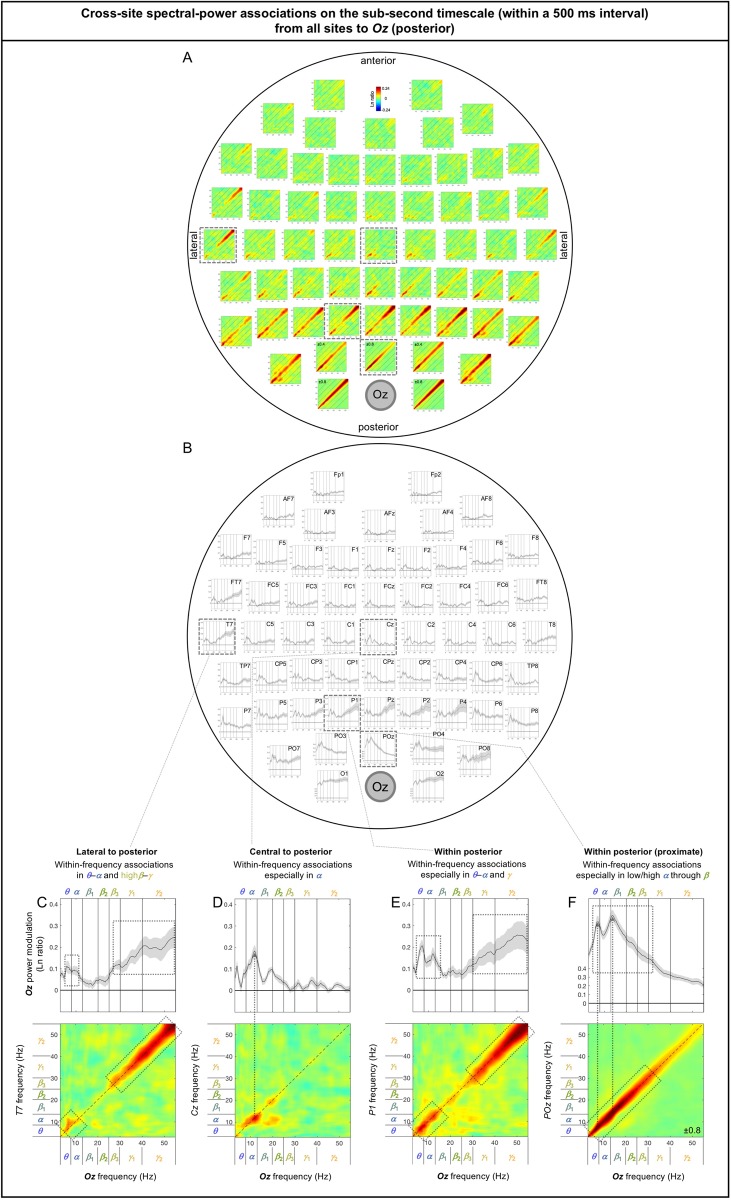
Fig 6. Cross-site spectral-power associations on the sub-second timescale (within a 500 ms interval) from all sites to Oz (a representative posterior site).
A. 2D spectral-power association plots. All associations were characteristically diagonal, indicative of within-frequency associations, while the ranges of associated frequencies varied across site-pairs. B. The values along the diagonal with the shaded regions indicating ±1 standard error of the mean (with participants as the random effect). C-F. Representative associations. C. T7 (a left-lateral site) to Oz spectral-power associations, characterized by within-frequency associations in the θ-α and highβ-γ bands, skipping the middle (β band). D. Cz (a central site) to Oz spectral-power associations, characterized by within-frequency associations primarily in the α band. E. P1 (a posterior site) to Oz spectral-power associations, characterized by within-frequency associations particularly in the θ-α and γ bands, skipping the middle (β band). F. POz (an adjacent site) to Oz spectral-power associations, characterized by within-frequency associations particularly in the θ through lowβ bands. The color scale is shown at the top of part A (also indicated within association plots when different; for example, “±0.4” indicates that the color scale for the corresponding association plot ranges from –0.4 to +0.4).

