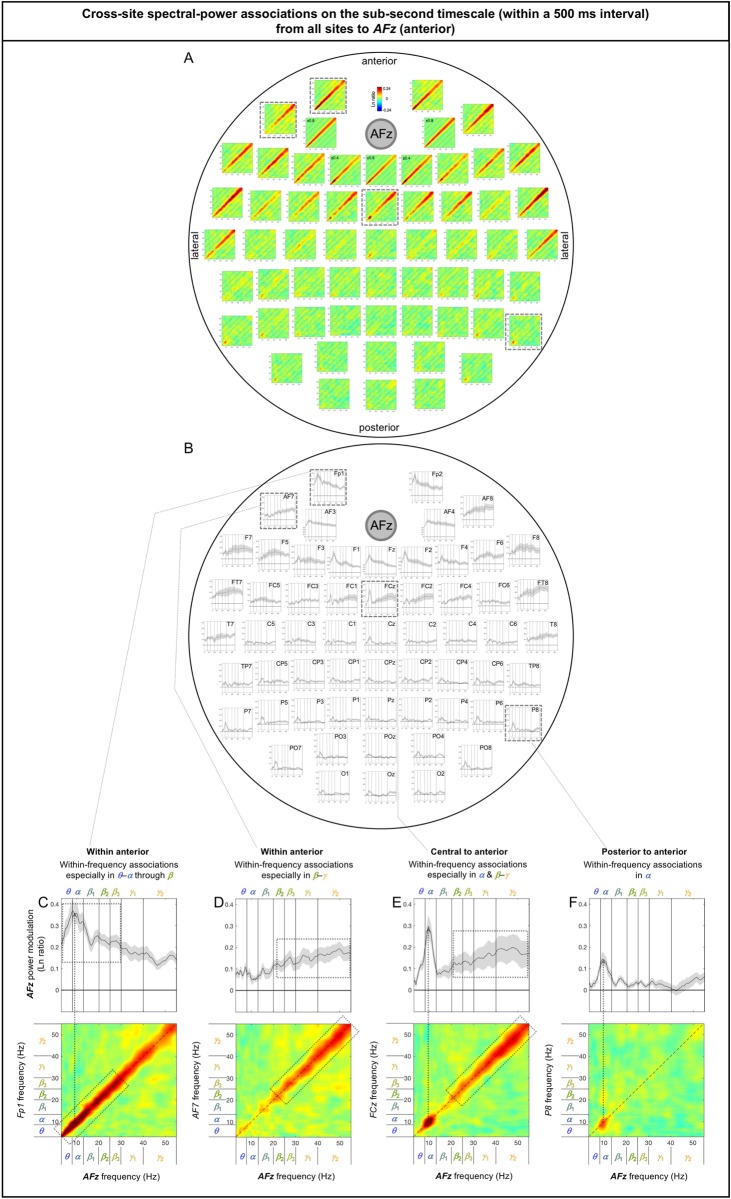
Fig 8. Cross-site spectral-power associations on the sub-second timescale (within a 500 ms interval) from all sites to AFz (a representative anterior site).
A. 2D spectral-power association plots. All associations were characteristically diagonal, indicative of within-frequency associations, while the ranges of associated frequencies varied across site-pairs. B. The values along the diagonal with the shaded regions indicating ±1 standard error of the mean (with participants as the random effect). C-F. Representative associations. C. Fp1 (an anterior site) to AFz spectral-power associations, characterized by within-frequency associations particularly in the θ-α through β bands. D. AF7 (an anterior site) to AFz spectral-power associations, characterized by within-frequency associations particularly in the β-γ bands. Note that although Fp1 and AF7 are adjacent anterior sites the frequency characteristics of their associations with AFz were opposite (the low-to-middle bands for Fp1 and the middle-to-high bands for AF7); this pattern was replicated on the right side at Fp2 and AF8 (see A and B). E. FCz (a central site) to AFz spectral-power associations, characterized by within-frequency associations particularly in the α and midβ-γ bands. F. P6 (a posterior site) to AFz spectral-power associations, characterized by within-frequency associations in the α band. The color scale is shown at the top of part A (also indicated within association plots when different; for example, “±0.4” indicates that the color scale for the corresponding association plot ranges from –0.4 to +0.4).

