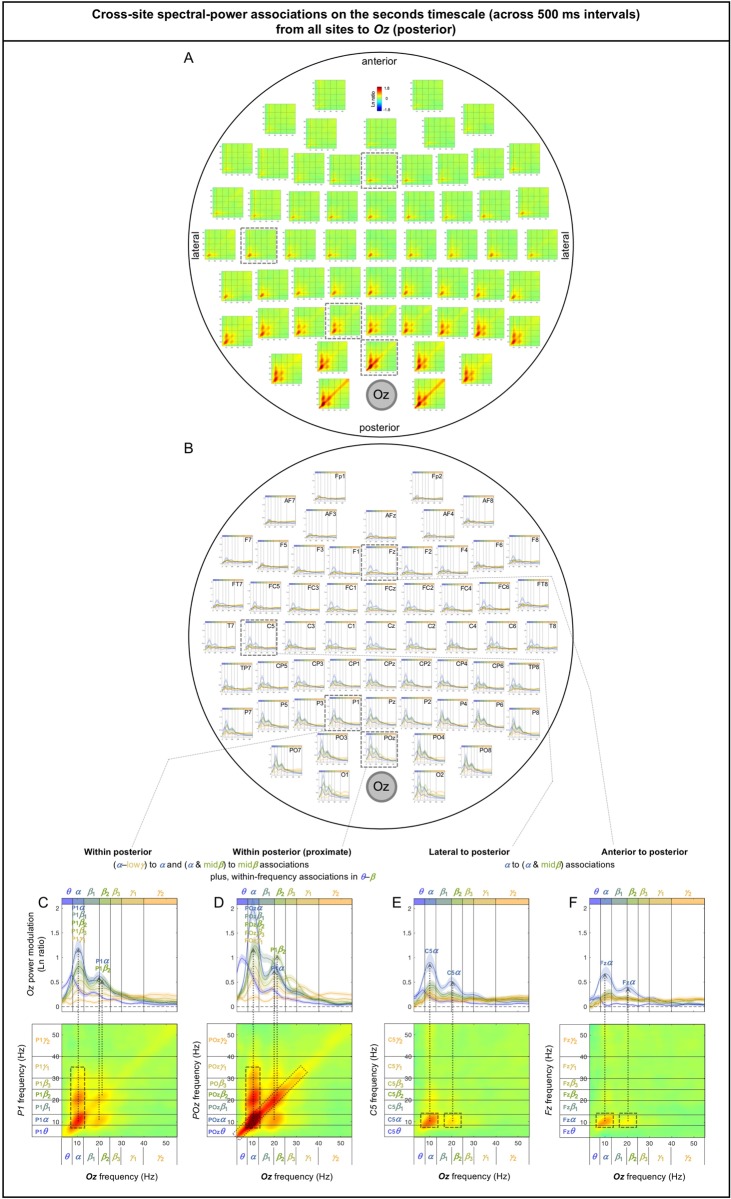
Fig 11. Cross-site spectral-power associations on the seconds timescale (across 500 ms intervals) from all sites to Oz (a representative posterior site).
A. 2D spectral-power association plots. Some associations are columnar, indicating multiple frequencies associated with a specific (primarily α) band, and some are diagonal, indicating within-frequency associations. B. Replotting of A. Each curve shows the spectral-power modulation at Oz associated with probe-site power variation in each major frequency band (lower-to-higher frequency bands labeled with cooler-to-warmer colors), with the shaded regions indicating ±1 standard error of the mean (with participants as the random effect). In other words, each curve shows a horizontal slice of a 2D-association plot for a specific probe-site frequency band (see the rectangular boxes in the bottom panels). C-F. Representative associations. C. P1 (a posterior site) to Oz spectral-power associations, characterized by the α-lowγ bands at P1 associated with the α-band at Oz (α-column), and the α-&-midβ bands at P1 somewhat associated the midβ band at Oz. D. POz (an adjacent site) to Oz spectral-power associations, characterized by the α-lowγ bands at POz associated with the α band at Oz (α-column), the α-β bands at POz somewhat associated with the midβ band at Oz (as in C, but stronger), and the diagonal (within-frequency) associations in the θ-β bands. E. C5 (a lateral site) to Oz spectral-power associations, characterized by the α band at C5 associated with the α band (and the midβ-band to some degree) at Oz. F. Fz (an anterior site) to Oz spectral-power associations, characterized by the α band at Fz associated with the α band (and the midβ band to some degree) at Oz (as in E). The color scale is shown at the top of part A. Note that spectral-power associations from most posterior sites to Oz contain α-columns. The color scale is shown at the top of part A.

