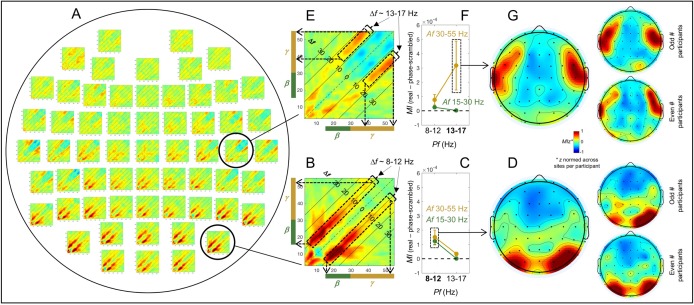
Fig 15. Relationship between the posterior Δf~ 10 Hz and lateral Δf~ 16 Hz spectral-power associations on the sub-second timescale and phase-amplitude coupling assessed as the Modulation Index (MI).
A. The spatial distribution of the spectral-power associations on the sub-second timescale (same as Fig 3D). B. A representative example of the posterior Δf~ 10 Hz (8–12 Hz, α band) associations for the β-γ frequencies at PO8. This pattern of spectral-power associations may imply a phase-amplitude coupling of the phase-frequency band (Pf) corresponding to Δf(8–12 Hz, α band) with the amplitude-frequency band (Af) in both the β (green bars) and γ (gold bars) ranges (see dashed rectangles and arrows). C. The phase-amplitude coupling assessed as MI (MI for real data minus MI for phase-scrambled data) at PO8. As implied by the spectral-power associations shown in B, MI was elevated selectively for the combination of Pf = 8–12 Hz (α band) with both Af = 15–30 Hz (β band) and Af = 30–55 Hz (γ band) (highlighted with the dashed rectangle). To confirm selectivity, MI was not elevated for the combination of Pf = 13–17 (lowβ band) with Af = 15–30 Hz (β band) or Af = 30–55 Hz (γ band). The error bars represent ±1 standard error of the mean with participants as the random effect. D. Left. Spatial distribution of MIz (z-normalized across sites per participant to focus on the spatial patterns of MI) averaged for the combinations of Pf = 8–12 Hz (α band) with Af = 15–30 Hz (β band) and Af = 30–55 Hz (γ band) (e.g., the dashed rectangle in C) predicted to be elevated by the posterior spectral-power associations shown in B. The posterior distribution of MIz largely parallels the posterior distribution of the Δf~ 8–12 Hz associations (see A). Right. The MIz distributions plotted separately for the odd and even numbered participants showing the degree of inter-participant variability. E. A representative example of the lateral Δf~ 16 Hz (13–17 Hz, lowβ band) associations for the γ frequencies at C6. This pattern of spectral-power associations may imply a phase-amplitude coupling of the phase-frequency band (Pf) corresponding to Δf(13–17 Hz, lowβ band) with the amplitude-frequency band (Af) in the γ (gold bars) range (see the dashed rectangles and arrows). F. The phase-amplitude coupling assessed as MI (MI for real data minus MI for phase-scrambled data) at C6. As implied by the spectral-power associations shown in E, MI was elevated selectively for the combination of Pf = 13–17 Hz (lowβ band) with Af = 30–55 Hz (γ band) (highlighted with dashed rectangle). To confirm selectivity, MI was not elevated for the combination of Pf = 13–17 (lowβ band) with Af = 15–30 Hz (β band); neither was it elevated for the combination of Pf = 8–12 Hz (α band) with Af = 15–30 Hz (β band) or Af = 30–55 Hz (γ band). The error bars represent ±1 standard error of the mean with participants as the random effect. G. Left. Spatial distribution of MIz (z-normalized across sites per participant to focus on the spatial patterns of MI) for the combination of Pf = 13–17 Hz (lowβ band) with Af = 30–55 Hz (γ band) (e.g., the dashed rectangle in F) predicted to be elevated by the lateral spectral-power associations shown in E. The lateral distribution of MIz largely parallels the lateral distribution of the Δf~ 13–17 Hz associations (see A). Right. The MIz distributions plotted separately for the odd and even numbered participants showing the degree of inter-participant variability.

