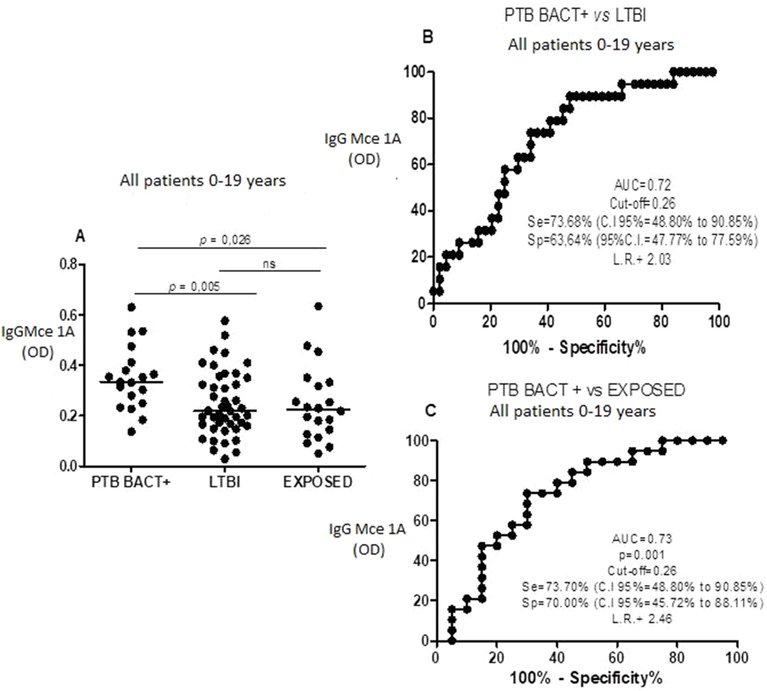
Fig. 3.
Levels of igG anti-Mce 1A (A) in patients (age 0–19 years) with pulmonary TB positive bacteriogically (PTB BACT+), latent tuberculosis infection (LTBI) and exposed to TB (TBE). Receiver operator characteristic (ROC) curve (B) Comparing igG anti-Mce 1A level in PTB BACT + versus (vs) ILTB and (C) ROC curve comparing igG anti-Mce 1A level in PTB BACT + versus (vs) TBE. AUC = area under the curve, Se = sensitivity, sp = specificity Cl = confidence intervel, ns = not significant and LR = likehood ratio.

