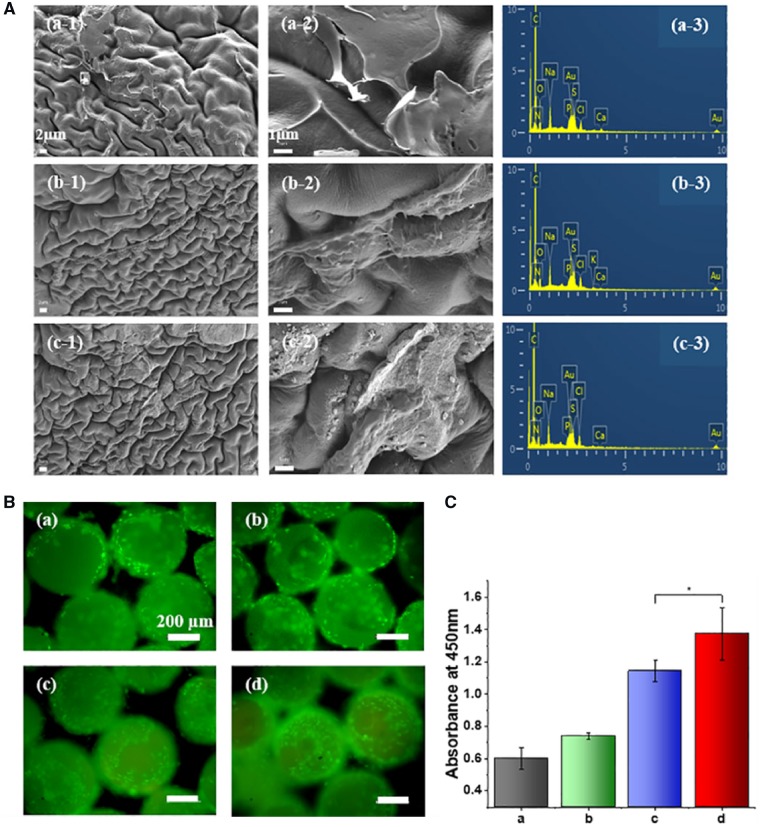
Figure 5.
(a) SEM micrographs (-1 and -2) and EDX analysis (-3) of the repeated decellularized PEEK microcarriers for 1 time (a), 2 times (b) and 3 times (c). All the scale bars for (-1) and (-2) were 2 and 1 μm. (b) Micrographs of adherent cells on the original topological (a), decellularized for 1 time (b), 2 times (c) and 3 times (d) of PEEK microcarriers incubated for 7 days, respectively. The cells were stained with calcein AM (green). All the scale bars were 200 μm. (c) The quantification of cell proliferation evaluated by CCK-8 assay, *P < 0.05

