Figure 2.

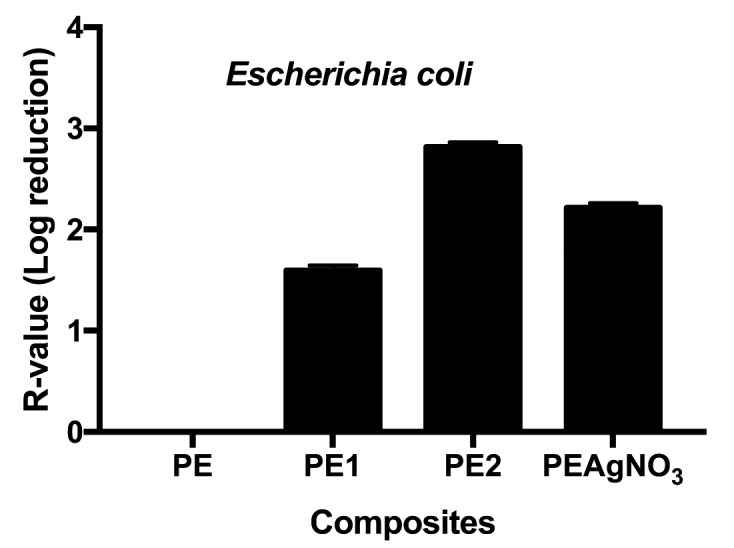
R-values obtained for Escherichia coli; unpaired t test of PE1 vs PAgNO3 was t=131.5 with a ***p value< .0001, and of PE2 t=127.3 with a ***p value <.0001

R-values obtained for Escherichia coli; unpaired t test of PE1 vs PAgNO3 was t=131.5 with a ***p value< .0001, and of PE2 t=127.3 with a ***p value <.0001