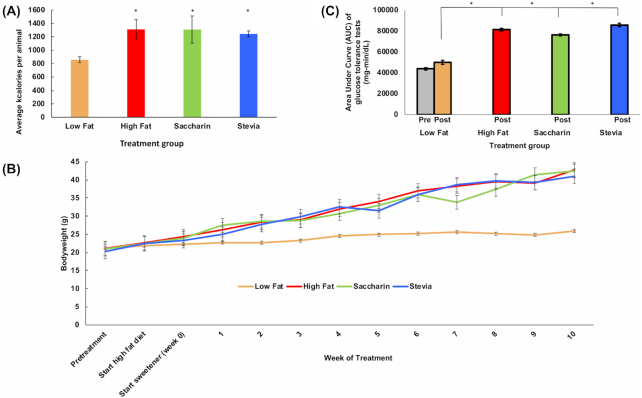
Figure 2.
Physiological effects of stevia treatment. (A) Caloric intake over 10 week treatment indicates that animals on a high fat diet ate significantly more calories than those on a low-fat diet, and that addition of stevia or saccharin to the drinking water of mice on a high fat diet did not influence caloric intake. Graph displays aggregate data of both males and females. * P < 0.05 vs low fat. (B) Mice in the low fat group have significantly lower body weight than any of the mice in the experimental treatments (P < 0.0001). No significant difference was observed between groups on a high fat diet (high fat, saccharin, stevia). (C) Area under the curve (AUC) analysis of glucose tolerance tests in aggregate. All animals on a high fat diet showed elevated AUC when administered a glucose tolerance test (P < 0.0001 males, 0.003 females), and addition of NAS to the drinking water did not significantly affect the AUC vs high fat diet alone. Low fat was significantly lower than all other groups.

