
Figure 5.
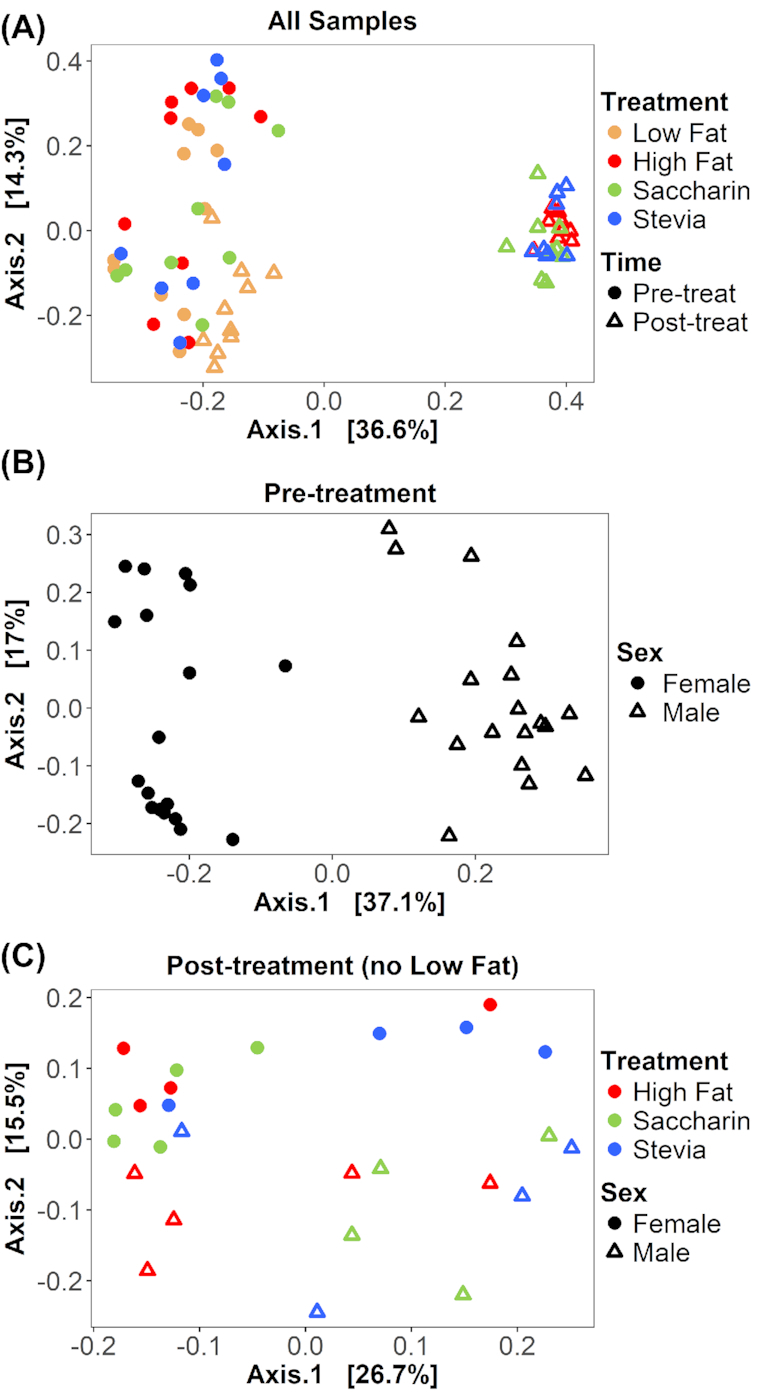
Between-sample diversity is different between time, sex and treatment. Bray–Curtis dissimilarity is visualized on principal coordinate analysis (PCoA) ordinations. (A) All 72 samples from 36 individuals are displayed, with treatment represented by color and time (pre-treatment or post-treatment) represented by shape. With each treatment, all pre-treatment samples are significantly different from post-treatment samples (PERMANOVA, all adjusted P = 0.002). Notably, low fat post-treatment samples cluster distinctly from all other post-treatment samples. (B) Only 36 pre-treatment samples are displayed, with sex distinguished by shape. Sex is significantly different in pre-treatment samples (adjusted P = 0.001). (C) Only post-treatment samples from high fat diets (high fat, saccharin and stevia) are displayed (n = 26), with treatment represented by color and sex represented by shape. There is no significant difference between all high fat and all saccharin samples (adjusted P = 0.188) nor between all high fat and all stevia samples (adjusted P = 0.351). However, all saccharin and all stevia samples are significantly different (adjusted P = 0.039). When considering sex-driven differences, saccharin and stevia were significantly different in females (adjusted P = 0.048) but not males (adjusted P = 0.444).