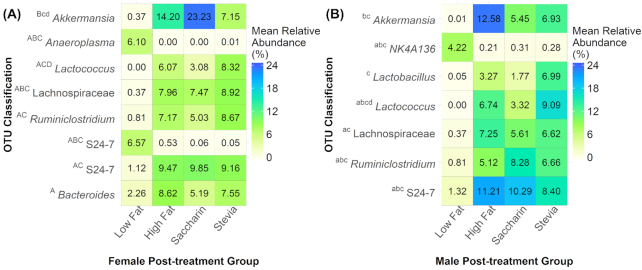
Figure 6.
Mean relative abundances of OTUs that significantly contribute to between-sample diversity. OTUs were identified using SIMPER and classification is shown for the most resolved taxonomic level. The heatmaps represent comparisons of treatment groups in post-treatment samples for females (A) and males (B). Annotations represent significant results for the following comparisons: A = low fat versus high fat, B = low fat versus saccharin, C = low fat versus stevia, D = saccharin versus stevia. Uppercase letters represent significance (adjusted P < 0.05) and lowercase letters represent a trend (0.10 > adjusted P > 0.05). Females had eight significant OTUs while males had seven trending OTUs. Almost all significant OTUs were identified in comparisons between low fat and high fat diet samples. Two OTUs contributed to differences between saccharin and stevia samples: one Lactococcus species and one Akkermansia species.

