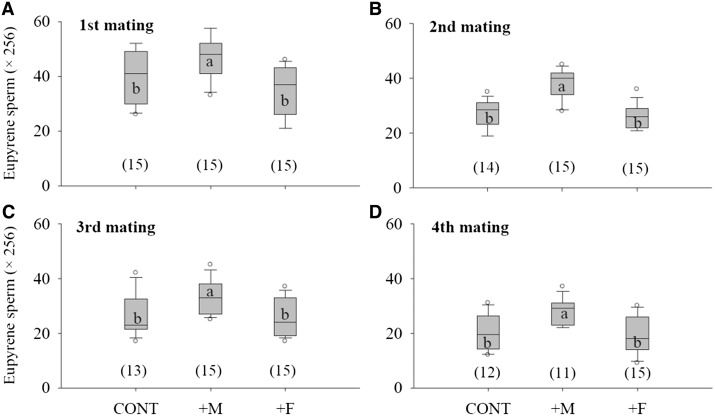
Figure 2.
Number of eupyrene sperm ejaculated in the first four matings. For each mating, boxes with the same letters are not significantly different (ANOVA: P > 0.05). For each box plot, the lower and upper box lines indicate 25% and 75% of scores falling beyond the lower and upper quartiles, respectively; the line in a box shows the median score; the ‘⊥’ and ‘⊤’ are the lower and upper whiskers representing scores outside the 50% middle; the circles are the outliers of minimum or maximum scores. Numbers in brackets under box plots are sample sizes.

