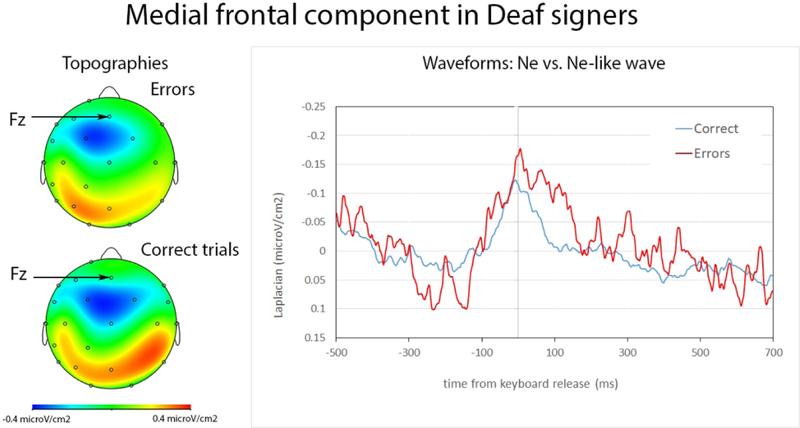
Figure 2:
Ne and Ne-like wave in deaf participants. On the left, topography of Ne at the peak latency. On the right, waveforms for the Ne (in red, errors) and Ne-like waves (in blue, correct trials) time-locked to keyboard release (in ms). The Ne and Ne-like wave reach their maxima around keyboard release time and the Ne is marginally larger than the Ne-like wave.

