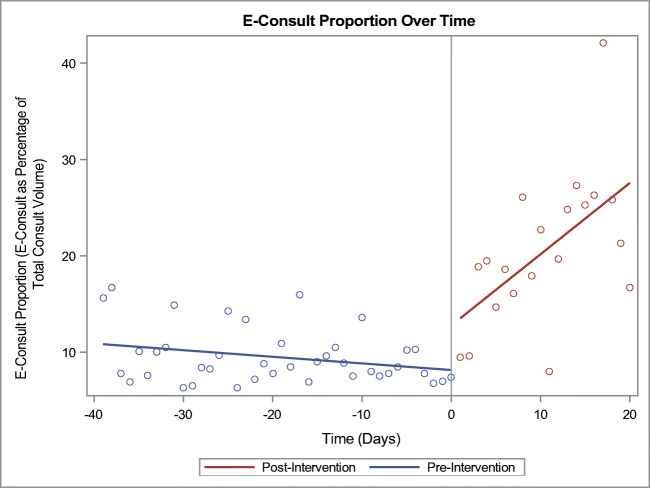
Figure 2.
e-Consult proportion over time. This figure demonstrates e-consult proportion (the e-consult proportion of total referral volume) as a function of time. The vertical line at time 0 represents the date of intervention (March 11, 2020). Points to the left of this line represent data obtained prior to this date; points to the right represent data obtained after this date. Tick marks refer to the number of days in either direction. A linear model was fitted to the pre- and post-intervention data to better demonstrate the changing trend in e-consult proportion over time.

