. 2020 Apr 14;9:e55517. doi: 10.7554/eLife.55517

Figure 1. Structure of the portal protein in situ.

(A) Cryo-electron micrograph of P23- 45 procapsids, scale bar 50 nm. (B) Cryo-EM reconstruction map with one subunit coloured red, scale bar 50 Å, and same for (C) but rotated 90°, viewed along 12-fold axis. (D) Ribbon diagram of one portal protein subunit. (E) Regions of the map and corresponding atomic models with residue numbers.

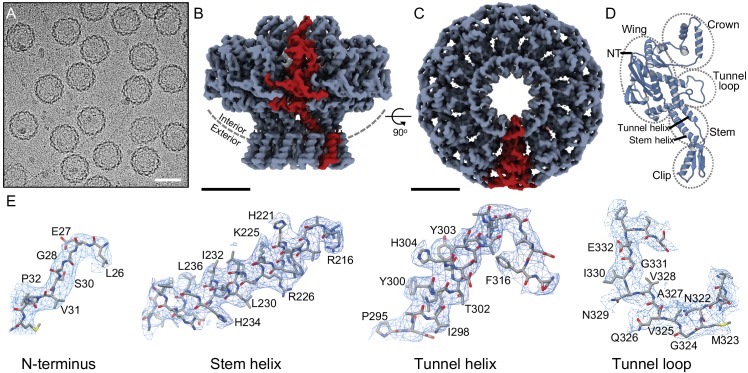
Figure 1.

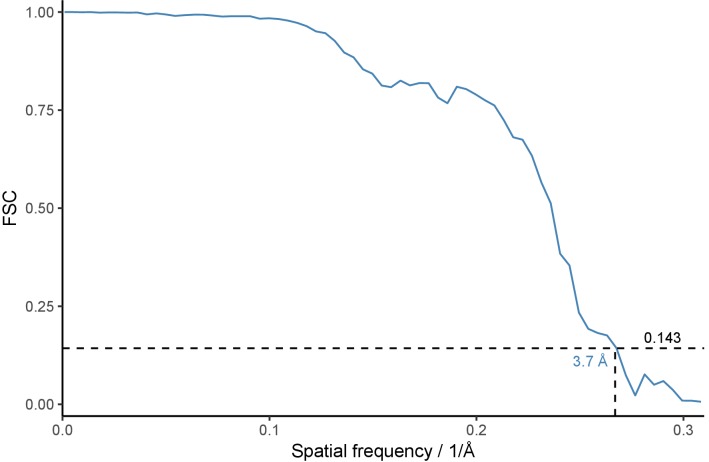
Figure 1—figure supplement 1. FSC curve for the portal protein reconstruction.

Figure 1—figure supplement 1.

Fourier Shell Correlation is plotted as function of spatial frequency. Dotted lines denote resolution estimate at FSC = 0.143 according to the gold-standard method.
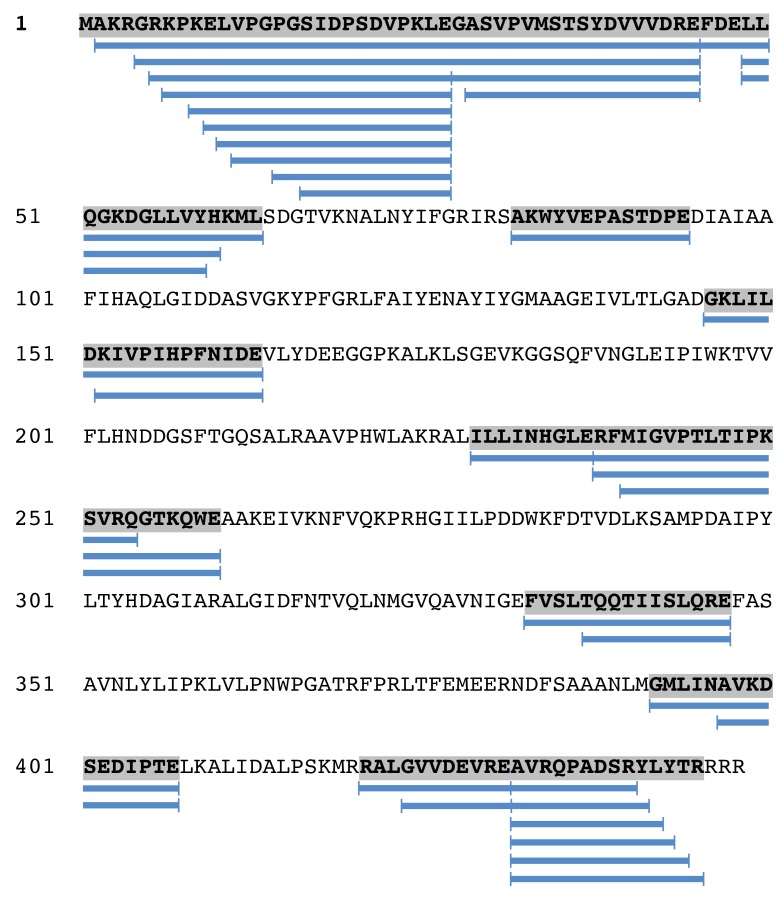
Figure 1—figure supplement 2. Mass spectrometry analysis of the portal protein from unexpanded capsids.

Figure 1—figure supplement 2.

Blue bars beneath the sequence denote regions for which peptides were detected.