
Figure 6. Cumulative percentages of antigen-specific T cells detected by multimer staining in polyclonally expanded TILs.
The specificity of 12.2 ± 7.3% (mean ± SD, max 25.9%, min 4.6%) of CD8+ T cells toward 3.1 ± 2.0 (mean ± SD, max 7, min 1) peptides derived from shared antigens was determined. The same colors do not represent the same alleles or antigens.
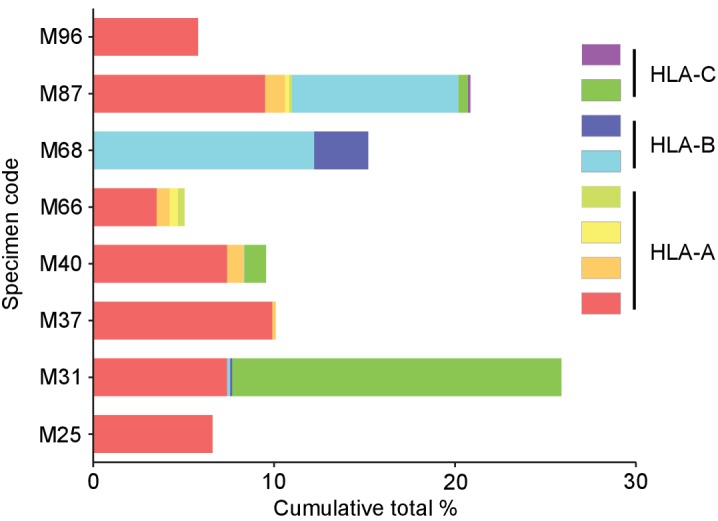
Figure 6—figure supplement 1. The efficiency of peptide exchange in soluble monomeric HLA class IQ115E-Kb monomers.

The efficiencies of peptide exchange in soluble HLA class IQ115E-Kb monomers for A*02:01 (A), B*07:02 (B), and C*07:02 (C) were measured by peptide competition binding assay and ELISA. The biotinylated peptides used were HLA-A*02:01-restricted telomerase540-548 ILAK(-biotin)FLHWL, B*07:02-restricted MiHAg SMCY1041-1051 SPSVDK(-biotin)ARAEL, and C*07:02-restricted adenovirus B585-593 FRK(-biotin)DVNMVL. The class I-restricted peptides employed are shown in Supplementary files 1b, d, and h. The peptide exchange efficiencies in the A*02:01, B*07:02, and C*07:02 monomers were 62.0 ± 14.9% (mean ± SD), 94.2 ± 12.0%, and 80.5 ± 22.1%, respectively. The A*01:01-restricted N-ras55-64 (A, C), A*01:01-restricted MART2446-456 (C), A*02:01-restricted gp100177-186 (C), A*02:01-restricted TRP-2360-368 (B), A*03:01-restricted myosin class I911-919 (A, B), B*44:02-restricted MAGE-C2307-315 (A), and C*06:02-restricted MUM-1126-134 (B) peptides were used as irrelevant controls (Supplementary files 1a,b,i). The data shown represent the mean ± SD of experiments performed in triplicate. All the results are representative of at least two independent experiments.
Figure 6—figure supplement 2. Stability of the reagents after peptide loading and multimerization.

Jurkat 76/CD8 cells transduced with the A*02:01/MART127-35 TCR (clone DMF5), B*07:02/NY-ESO-160-72 TCR, or C*03:04/NY-ESO-192-100 TCR were stained with the cognate multimer at the indicated time points after loading with peptides (A) or multimerization with anti-His mAb (B). The A*02:01/NY-ESO-1157-165 TCR (clone 1G4LY) was used as a control. The percentages of multimer+ CD8+ T cells are shown. The data shown are representative of two independent experiments.
Figure 6—figure supplement 3. Multiplex pHLA mutimer staining.

Multiplex staining of TILs with PE-conjugated and APC-conjugated multimers, as indicated, in a single tube (right panels) for M31 (A), M68 (B), and M87 (C, D). Single multimer staining in individual tubes is shown in left panels. A*02:01/HTLV-1 tax11-19 (A, C, D), C*03:04/HIV gag164-172 (A), B*07:02/HIV nef128-137 (B), and B*18:01/HIV gag161-170 (D) multimers were used as negative controls. The percentages of multimer+ cells in CD8+ T cells are shown (left panels). The data shown are representative of two independent experiments. Legends for Supplementary files.