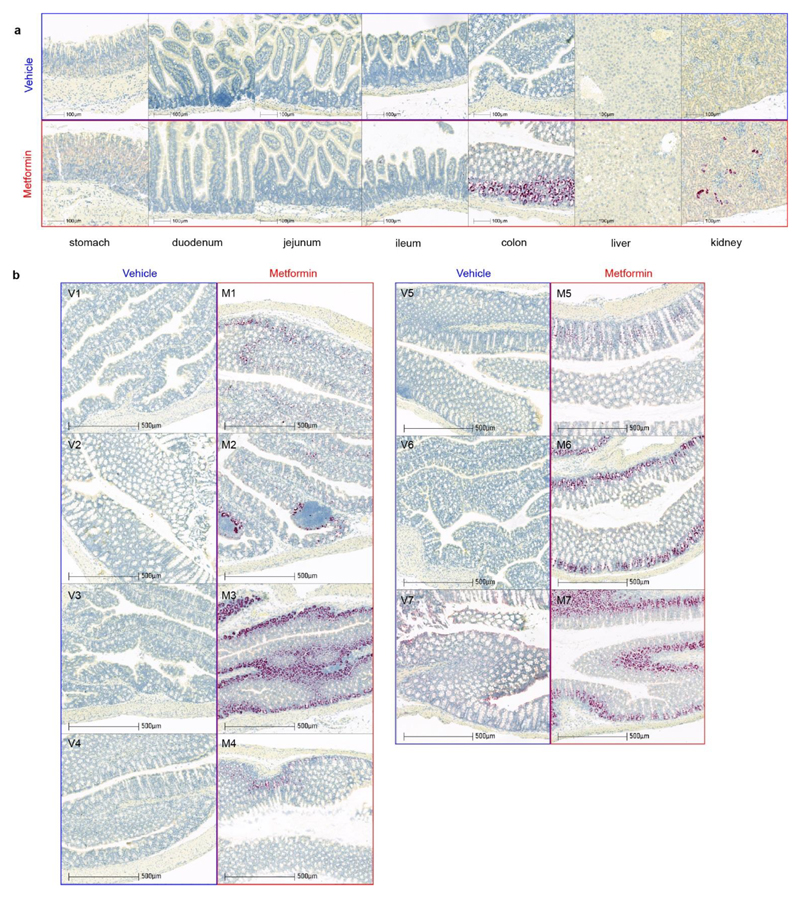
Extended Data Figure 7.
a, Representative images from the mouse with circulating GDF15 level closest to group median shown in Fig4b with images from other regions of the gut and from liver. b, In situ hybridization for Gdf15 mRNA expression (red spots) in colon. Tissue collected from high-fat fed wild type mice, 6 hrs after single dose of oral metformin (600mg/kg)(right side, red box, m1-m7) or vehicle gavage (left side, blue box, v1-v7), n=7/group, mice as Figure 4.

