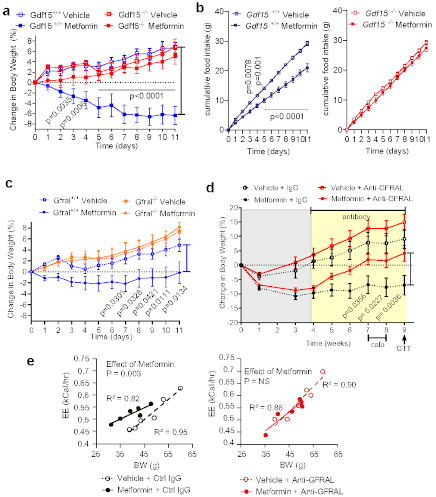
Figure 2. GDF15/GFRAL signalling is required for the weight loss effects of metformin on a high fat diet.

a, Percentage change in body weight of Gdf15+/+ and Gdf15-/- mice on a high-fat diet treated with metformin (300mg/kg/day) for 11 days, mean ± SEM, n=6/group except Gdf15+/+ vehicle n=7, P by 2-way ANOVA with Tukey’s correction for multiple comparisons.
b, Cumulative food intake of mice as Figure 2a, P by 2-way ANOVA with Tukey’s correction for multiple comparisons.
c, Percentage change in body weight of Gfral+/+ and Gfral-/- mice on a high-fat diet treated with metformin (300mg/kg/day) for 11 days, mean ± SEM, n=6/groups, P by 2-way ANOVA with Tukey’s correction for multiple comparisons.
d, Percentage change in body weight of metformin-treated obese mice dosed with an anti-GFRAL antagonist antibody, weekly for 5 weeks (yellow), starting 4 weeks after initial metformin exposure (grey),mean ± SEM, n=7 Vehicle + control IgG and Metformin + anti –GFRAL, n=8 other groups, P by 2-way ANOVA with Tukey’s correction for multiple comparisons. “calo” = period in which energy expenditure measured (see Figure 2e), Arrow and “GTT”- timing of oral glucose tolerance test (see Figure 3e-h).
e, ANCOVA analysis of energy expenditure against body weight of mice treated as in Figure 2d, n=6 mice/group. Data are individual mice and P for metformin calculated using ANCOVA with body weight as a covariate and treatment as a fixed factor.
