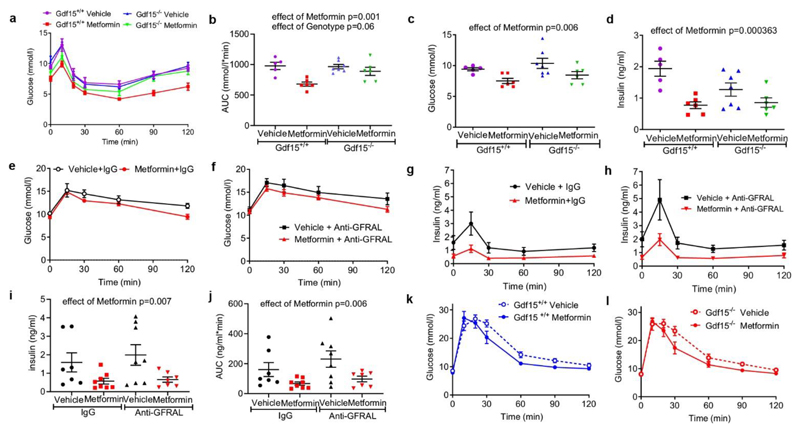
Figure 3. Effects of metformin on glucose homeostasis.
a, Insulin tolerance test (ITT) (insulin=0.5 U/kg) after 11 days of metformin treatment (300mg/kg) to high fat fed Gdf15 +/+ and Gdf15 -/- mice, glucose levels are mean ± SEM, n=6/group, except Gdf15 -/- vehicle= 7, Gdf15+/+ vehicle= 5.
b, Area under curve (AUC) analysis of glucose over time in Figure 3a, mean ± SEM, P by 2-way ANOVA, interaction of genotype and metformin p= 0.037.
c, Fasting glucose (time 0) of ITT in Figure 3a, mean ± SEM, P by 2-way ANOVA, effect of genotype p= 0.144, interaction of genotype and metformin p= 0.988.
d, Fasting insulin (time 0) of ITT in Figure 3a, mean ± SEM, P by 2-way ANOVA, effect of genotype p= 0.131, interaction of genotype and metformin p 0.056.
e, f, Glucose over time after oral glucose tolerance test (GTT) in metformin treated obese mice given either IgG (e) or anti –GFRAL (f) once weekly for 5 weeks (as Figure 2d). AUC analysis by 2-way ANOVA, effect of antibody p= 0.031, effect of metformin p= 0.072, interaction of antibody and metformin p 0.91.
g, h, Insulin (mean ± SEM) over time after GTT in mice as Figure 3e and f.
i, Fasting insulin (time 0) of GTT in mice as Figure 3e and f, mean ± SEM, P by 2-way ANOVA, effect of antibody p= 0.544, interaction of genotype and metformin p 0.691.
j, AUC analysis of insulin over time in Figure 3g and h, mean ± SEM, P by 2 -way ANOVA, effect of antibody p= 0.197, interaction of genotype and metformin p 0.607.
k, l, Glucose (mean ± SEM) over time after intraperitoneal GTT in high fat fed mice given single dose of oral metformin (300mg/kg) 6 hrs before GTT, n=8/group.

