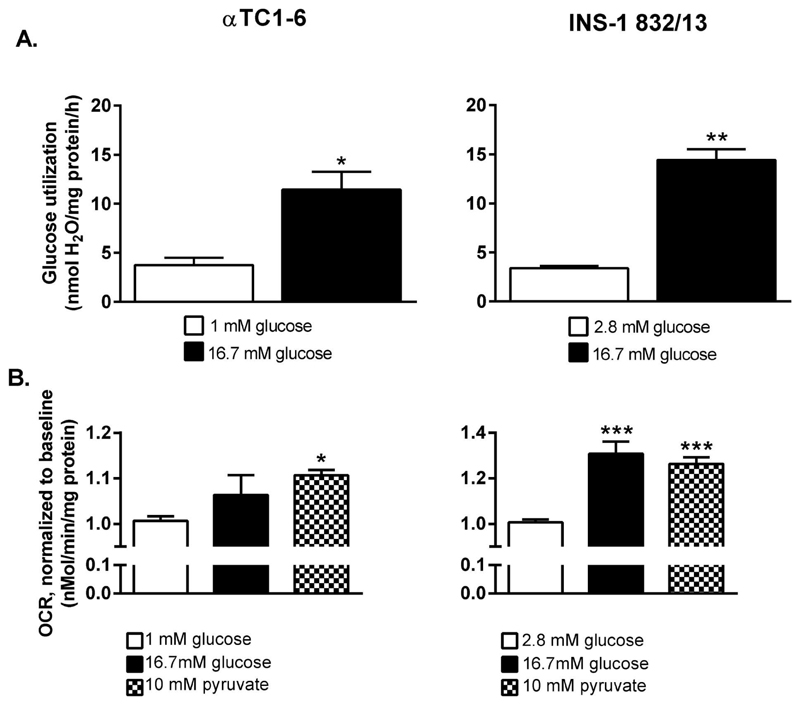
Figure 3. The coupling between glycolytic and mitochondrial glucose oxidation is more efficient in the INS-1 832/13 than in the αTC1-6 cell line.
(A) Glucose utilization increase in αTC1-6 cells and INS-1 832/13 cells stimulated with 16.7 mM glucose. (B) Oxygen consumption rate (OCR) in the αTC1-6 cell line and the INS-1 832/13 cells after stimulation with 16.7 mM glucose and 10 mM pyruvate. OCR was measured first at 1 mM (αTC1-6) or 2.8 mM (INS-1 832/13) glucose (baseline) followed by measurements after injection of 16.7 mM glucose or 10 mM pyruvate. Data are expressed as mean ± SEM for n=3 (A), n=3 (10 mM pyruvate and 16.7 mM glucose for αTC1-6 in B), n=5 (16.7 mM glucose for INS-1 832/13 in B), n=8 (baseline INS-1 832/13), and n=6 (baseline αTC1-6). Statistical significance was assessed by the Student´s t-test (A) and ANOVA followed by the Newman-Keuls multiple correction method post hoc (B); *p<0.05, **p<0.01, ***p<0.001.

