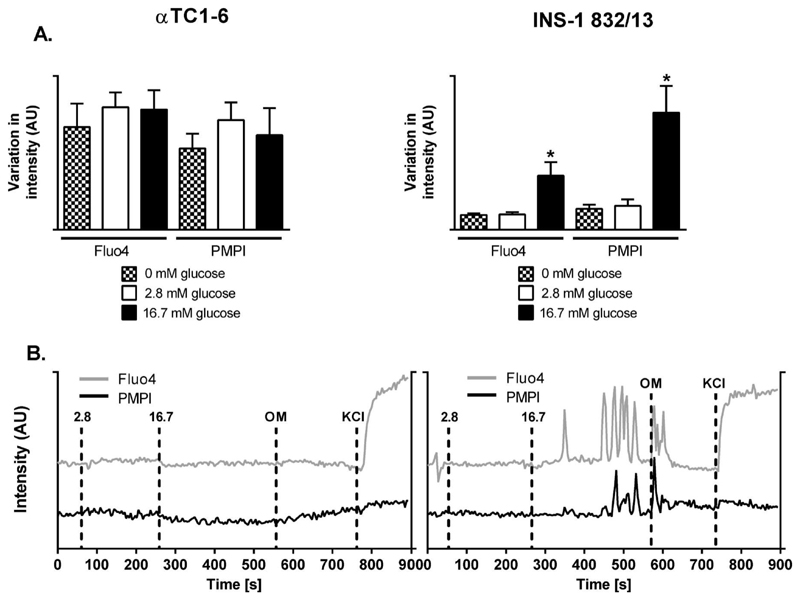
Figure 5. Glucose elicits strong responses in plasma membrane potential and Ca2+-fluxes in the INS-1 832/13 cells.
(A) Plasma membrane potential oscillations and Ca2+-fluxes expressed as standard deviations in αTC1-6 and INS-1 832/13 cells at 0, 2.8, and 16.7 mM glucose. (B) Representative traces for αTC1-6 cells and INS-1 832/13 cells; markers: 2.8-2.8 mM glucose, 16.7-16.7 mM glucose, OM-0.5 ng/μl Oligomycin, KCl-25 mM KCl. Data in (A) are expressed as mean standard deviation for the traces corresponding to the respective glucose level± SEM for n=7.

