
Figure 1.
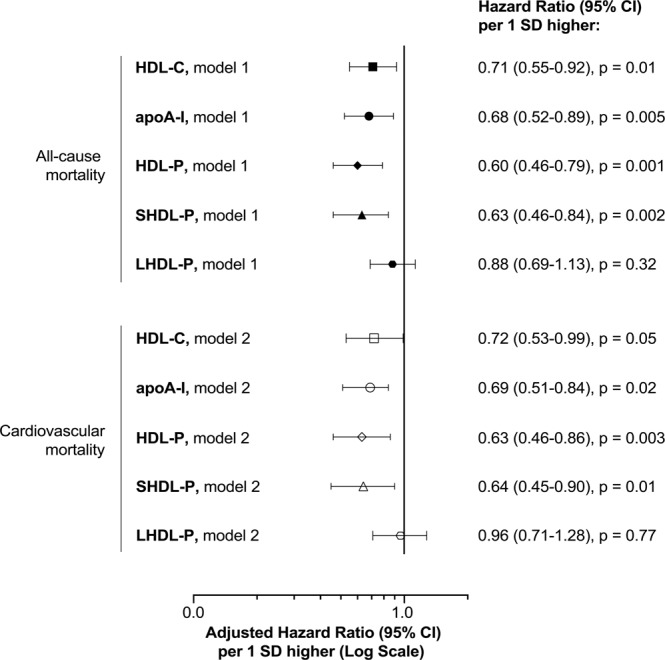
Relative risk of all-cause and cardiovascular mortality as a function of HDL-C, apoA-I, HDL-P, SHDL-P and LHDL-P. Graphic represents hazard ratios (dots) and corresponding 95% confidence interval (95% CI) for risk of all-cause and cardiovascular mortality per 1 standard deviation increase of HDL-C, apoA-I, HDL-P, SHDL-P or LHDL-P. Among the 78 deceased patients analyzed, the number of CV death was 50. Model 1: adjusted for age, smoking, treatment for dyslipidemia, eGFR, LVEF, duration of CAD and Gensini score. Model 2: adjusted for treatment for dyslipidemia, LVEF, duration of CAD and Gensini score.