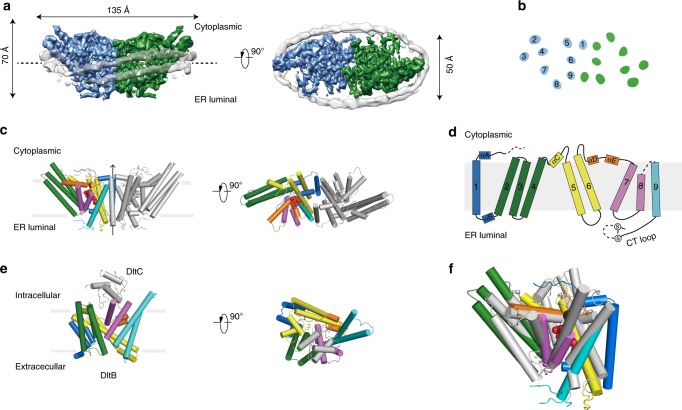
Fig. 3. The structure of hSOAT1 dimer.
a Cryo-EM map of hSOAT1 dimer in side view and top view. Two subunits of the dimer are colored in green and blue. Density corresponding to the nanodisc is colored in gray with semi-transparency. b Top view of the cross-section of the transmembrane domain at the approximate level indicated by the dashed lines in a. The identities of the transmembrane helices from the blue subunit are labeled in numbers. c The structural models of hSOAT1 dimer are shown in side view and top view. Helices are shown as cylinders. One subunit of hSOAT1 is in rainbow color and the other subunit is in gray. CI-976 molecule is shown as red spheres. d The topology of one hSOAT1 subunit. The colors are used in the same way as in c. e The crystal structure of DltB-DltC complex in side view and top view (PDB ID: 6BUG). The DltB subunit is in rainbow color while the DltC subunit is in gray. f The superposition of DltB (gray) onto one hSOAT1 protomer (colored).

