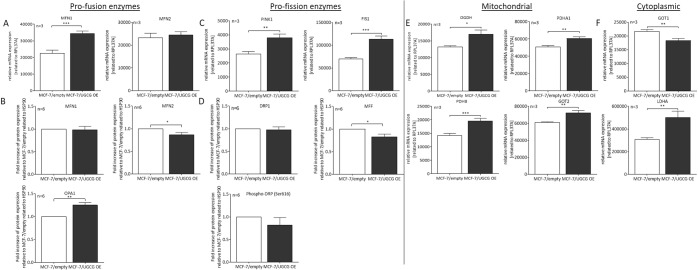
Figure 3.
UGCG overexpression impact on mitochondrial dynamics and mitochondrial and cytoplasmic enzymes. (A) The mRNA expression of the pro-fission enzymes mitofusin 1 (MFN1) and mitofusin 2 (MFN2) was determined by qRT-PCR analysis. The expression is related to the housekeeping gene (RPL37A). Data are presented as a mean of n = 3 ± SEM. (B) Protein concentration of MFN1, MFN2 and optic atrophy type 1 (OPA1) determined by Western blot analysis. Data are related to the housekeeping protein HSP90 and presented relative to MCF-7/empty control cells as a mean of n = 6 ± SEM. (C) mRNA levels of the pro-fission enzymes PTEN-induced kinase 1 (PINK1) and mitochondrial fission protein 1 (FIS1) related to RPL37A. Data are presented as a mean of n = 3 ± SEM. (D) Protein concentration determination of total dynamin related protein1 (DRP1), total mitochondrial fission factor (MFF) and phospho-DRP1 (Ser616) by Western blot analysis. Data are related to the housekeeping protein HSP90 and presented relative to MCF-7/empty control cells as a mean of n = 6 ± SEM. (E) mRNA expression analysis of alpha-ketoglutarate dehydrogenase (OGDH), pyruvate dehydrogenase E1 component subunit alpha (PDHA1), and beta (PDHB) and glutamate oxaloacetate transaminase 2 (GOT2) by qRT-PCR. The expression is related to RPL37A. Data are presented as a mean of n = 3 ± SEM. (F) mRNA expression analysis of glutamate oxaloacetate transaminase 1 (GOT1) and lactate dehydrogenase subunit A (LDHA) by qRT-PCR. The expression is related to RPL37A. Data are presented as a mean of n = 3 ± SEM. *p ≤ 0.05, **p ≤ 0.01, ***p ≤ 0.001.

