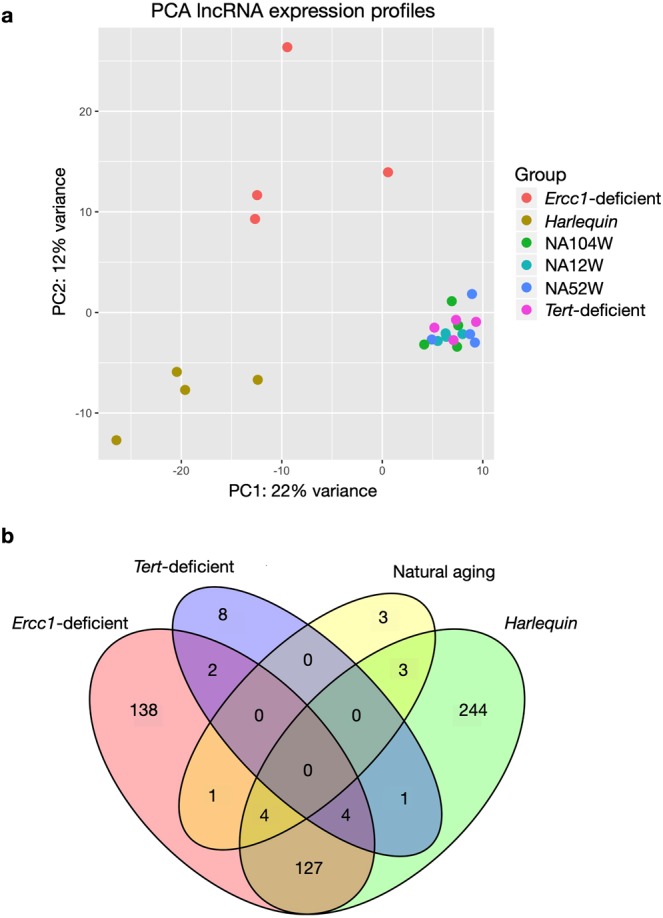
Figure 3.

LncRNA expression profiles in the natural and premature aging models. (a) PCA plot summarizing the lncRNA expression profiles of the hearts of the different models of senescence. The plot has been generated using the first two principal components, which together account for the 34% of the variance between samples, n = 4 hearts for each mouse model. (b) VENN diagram showing the number of significantly differentially expressed lncRNAs in each aging model resulting from the comparison to the wild-type youngest timepoint. NA12W, natural aging 12 week-old; NA52W, natural aging 52 week-old; NA104W, natural aging 104 week-old.
