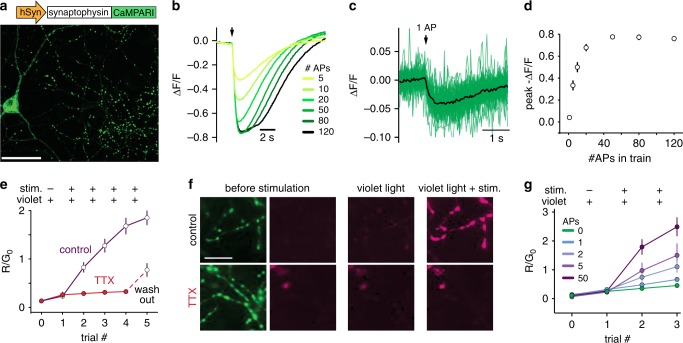
Fig. 1. Synaptophysin-fused CaMPARI marks active presynaptic terminals.
a Representative image of cultured rat hippocampal neurons expressing sypCaMPARI. Note the clear punctate labeling of axonal boutons. b Average fluorescence response of sypCaMPARI boutons (green channel emission) to varying numbers of action potentials (APs) evoked at 50 Hz (n = 6 neurons, 317 synapses). c Trial-averaged responses to 30 single APs (green, n = 57 synapses). Black line is the average response of n = 3 neurons. d Plot of the maximum ΔF/F versus number of APs from the experiments in b and c. e Plot of initial red to green ratio of boutons expressing sypCaMPARI at baseline, after photoconverting violet light alone (20 light pulses of 1 s duration at 0.1 Hz, 405 nm, 10.8 mW cm−2) and after simultaneous stimulation with trains of 50 APs at 50 Hz (trials 1–4). The experiment was performed in the absence or presence of 3 µM tetrodotoxin to block action potentials (control: n = 8 neurons; TTX: n = 7 neurons). Note that after washing out TTX, the R/G0 ratio (trial 5) increased to the same amplitude as the first instance in control neurons (trial 2). f Representative red (magenta, trial 0, trial 1, trial 3) and green (green, trial 0) images of boutons from the experiment in e. g The amount of photoconversion (R/G0) in a similar experiment as e but varying the number of APs in a 50 Hz train (20 light pulses of 1 s duration at 0.1 Hz, 405 nm, 54.1 mW cm−2; Stim: 20 bursts at 50 Hz). AP fold increase was statistically different from all other stimulation conditions using a one-way ANOVA with Tukey’s post-hoc comparison (*p = 0.032). Neurons per condition: 0 AP (n = 4), 1 AP (n = 4), 2 APs (n = 5), 5 APs (n = 5), 50 APs (n = 7). Data are presented as mean ± SEM in d, e, and g. Scale bar: 50 µm (a), 20 µm (f). Cultured neurons were 14–22 days old, expressing sypCaMPARI for 8–16 days.

