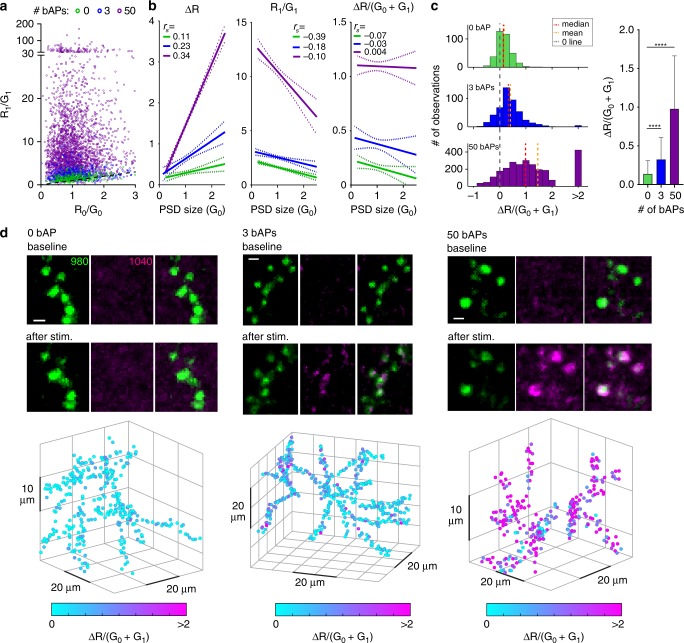
Fig. 4. PostSynTagMA photoconversion with back-propagating action potentials (bAPs).
2P image stacks of postSynTagMA expressing CA1 pyramidal neurons were taken before and after 15 pairings of trains of bAPs with photoconverting violet light (395 nm, 16 mW mm−2, 500 ms duration, 1 s delay). Synaptic transmission was blocked. a R/G ratios of individual synapses before (R0/G0) vs after (R1/G1) photoconversion. Note the variability in photoconversion within conditions. Dotted black line is the unity line. Magenta: 50 bAPs. Blue: 3 bAPs. Green: 0 bAP. b Three different metrics vs. PSD size (linear regression lines with 95% confidence intervals, see Supplementary Fig. 6a-c for regressions). ΔR is positively correlated with PSD size (0 bAPs: rs = 0.11, p = 0.03; 3 bAPs: rs = 0.23, p < 0.0001; 50 bAPs: rs = 0.34, p < 0.0001). Normalizing ΔR by (G0 + G1) removes the correlation with PSD size (0 bAP: rs = −0.07, p = 0.164; 3 bAPs: rs = −0.03, p = 0.583; 50 bAPs: rs = 0.004 p = 0.876). rs is the correlation coefficient (Spearman’s rho). c Histograms of photoconversion ΔR/(G0 + G1) for each condition (0 bAP: median = 0.139, mean = 0.164; 3 bAPs: median = 0.327, mean = 0.406; 50 bAPs: median = 0.984, mean = 1.452). Values above 2 are binned. Right bar graph: ΔR/(G0 + G1) vs the number of bAPs (data are median and interquartile range; Kruskal-Wallis test followed by Dunn’s multiple comparsions: 0 bAP vs. 3 or 50 bAPs ****p < 0.0001, see Supplementary Fig. 6c for individual points). 0 bAP: n = 356 synapses, 1 neuron; 3 bAPs: n = 472 synapses, 1 neuron; 50 bAPs: n = 2587 synapses, 3 neurons. d Example green, red and merged images of SynTagMA-labeled synapses photoconverted with 0, 3 or 50 bAPs. 3D plots show the positions of individual synapses; markers are colored according to the calculated photoconversion value (ΔR/(G0 + G1)). Scale bar: 1 µm.

