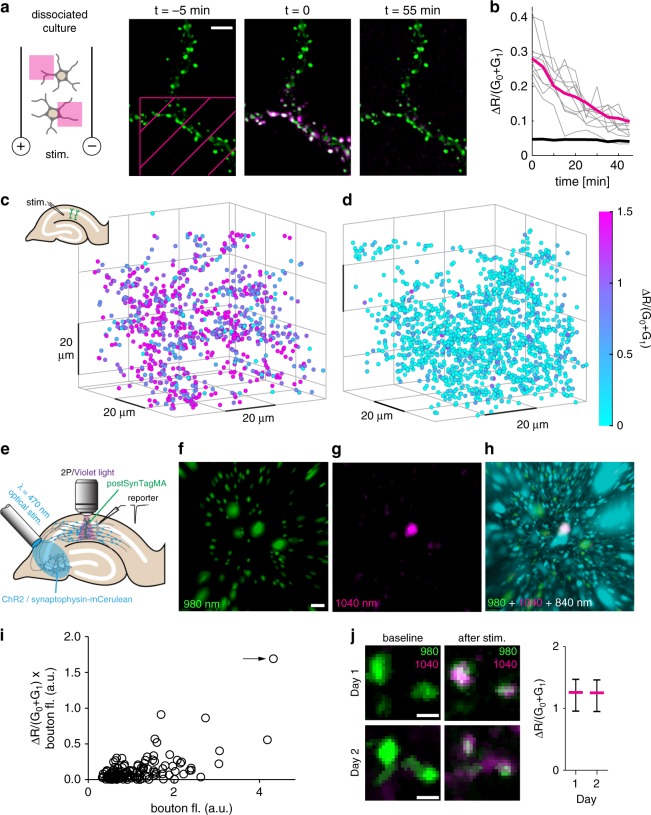
Fig. 6. Using postSynTagMA to map active synapses.
a Time series from a postSynTagMA-expressing neuron in culture. At t = 0, one violet light pulse was applied via DMD inside the magenta hatched area (405 nm, 18.6 mW mm−2, 0.5 s) while stimulating with a single train of action potentials delivered at 50 Hz for one second. b Inside the illuminated area, red fluorescence generated by photoconversion of postSynTagMA decayed exponentially with τ = 29.4 min (R2 = 0.99, n = 138 synapses, 2 experiments). Gray lines show individual synapses. For objects outside the illuminated square, ΔR/(G0 + G1) was constant (black line, n = 712 synapses, 2 experiments). c Photoconversion after Schaffer collateral stimulation in organotypic slice culture. Color-coded ΔR/(G0 + G1) of synapses plotted at their locations in the 65 × 65 × 78 µm volume of tissue. Strong stimulation of synaptic inputs was paired with violet light (100 ms, 395 nm, 16 mW mm−2, 50 repeats). Note that ΔR/(G0 + G1) is equal or greater than 1.5 for most of the synapses (n = 897 synapses). d As in c, but with weak stimulation, below the threshold for postsynaptic APs (n = 1502 synapses). e CA3 neurons expressing ChR2-ET/TC and synaptophysin-mCerulean were stimulated with 470 nm flashes to evoke subthreshold (~500 pA) excitatory synaptic responses in a patch-clamped CA1 neuron (reporter). Simultaneously, an adjacent postSyntagMA-expressing CA1 neuron was illuminated with violet light (same illumination as c–d). f Green spots (G0 + G1) segmented with Imaris™. g Red fluorescence after photoconversion (R1), masked by the green channel. Note the strongly photoconverted synapse (spot #1). h Spot #1 (magenta) is in close contact with a presynaptic ChR2-expressing terminal (cyan). Non-converted (green) spots are not in direct contact with cyan terminals. i Quantification of panels f–h (n = 167 spots). Arrow indicates spot #1. j Red/green overlay before and after photoconversion of the same synapses on successive days. Strong extracellular stimulation was paired with 395 nm light (500 ms, 1 s delay, 15×). Photoconversion of postSynTagMA was near-identical on day 1 and day 2 (p = 0.386, paired two-tailed t-test, n = 37 synapses, data presented as median ± interquartile range). All experiments were reproduced in at least twice independent experiments. Scale bars: 5 µm (a), 3 µm (f–h), 1 µm (j).

