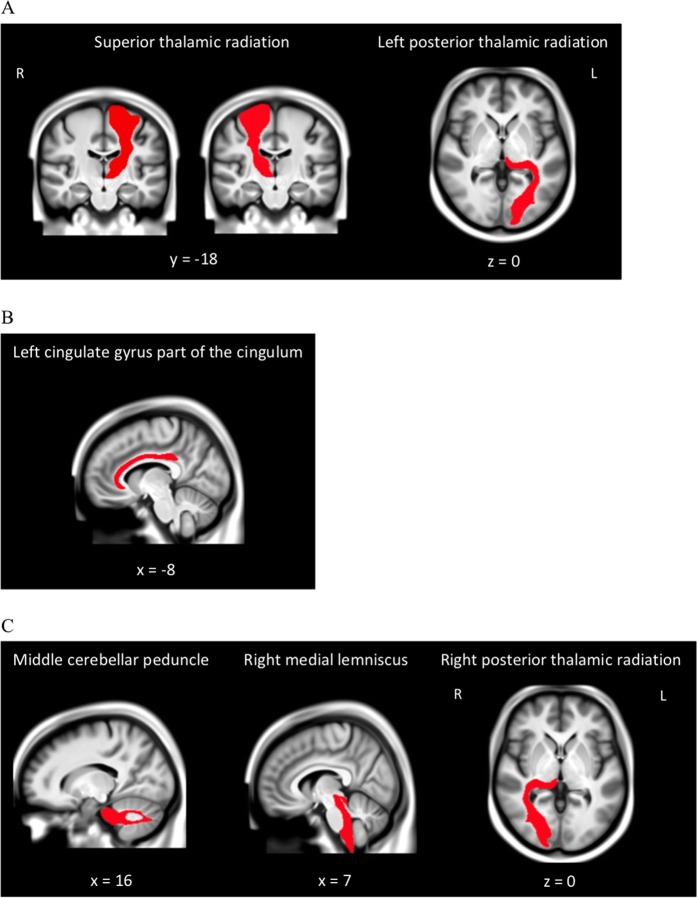
Fig. 2. Group-average structural MRI with significant white matter tracts overlaid, estimated from a subset of UK Biobank study participants (N = 4500).
Images derived from the publically available viewer (https://www.fmrib.ox.ac.uk/ukbiobank/group_means/index.html). Panel A depicts the tracts that were significant in both the fractional anisotropy (FA) and mean diffusivity (MD) analyses. Panel B depicts the tract that was significant in the FA analyses. Panel C depicts the tracts that were significant in the MD analyses.

