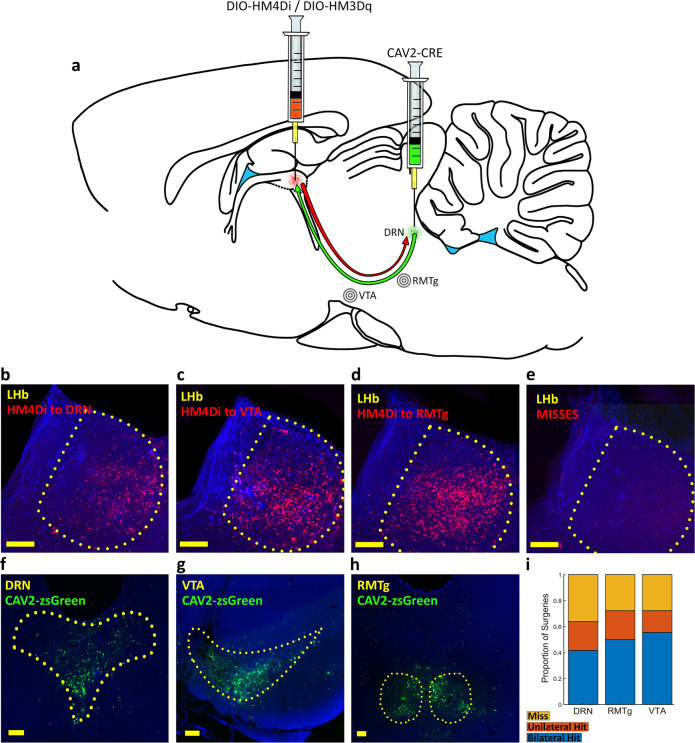
Fig. 1. Schematic diagram of intersectional DREADD expression.
a DIO-hM4Di or DIO-hM3Dq was injected bilaterally into the lateral habenula and CAV2-CRE was injected bilaterally into one of the three targeted LHb outputs (VTA, RMTg, or DRN). CAV2-CRE is taken up into terminals and transported retrogradely to LHb cell bodies where it drives the expression of DREADDs. b–d Maximum intensity projections of DREADD expression in each pathway. One representative slice from each successful surgery in the first experiment (FST) was automatically aligned and overlaid to provide a visual representation of hM4Di expression and the anatomical layout of neurons in each pathway. e Maximum intensity projection of LHb slices from “miss” animals. f–h A representative injection of CAV2-CRE mixed with 2.5% CAV2-zsGreen for visualization of terminal targets in the midbrain. i Proportion of surgeries deemed bilateral hit, unilateral hit, or miss. Scale bars = 200 µm.

