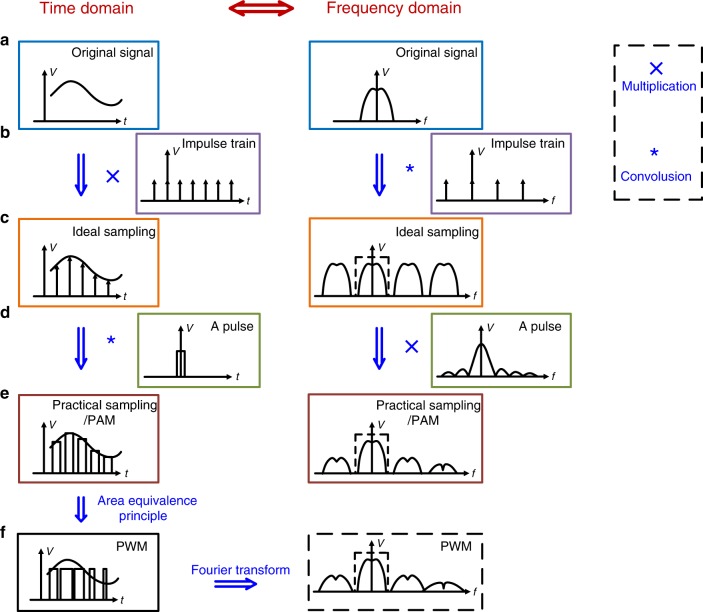
Fig. 1. Waveforms and spectrum corresponding to sampling and modulation.
This figure shows the relationship between sampling, PAM and PWM. Both time-domain waveforms and frequency-domain spectrum are depicted. a The continuous original signal to be sampled or modulated. b An impulse train, which is a sequence of Dirac functions and can be employed as a sampling function. c The ideal sampling result, which is the result of the multiplication of a and b in the time domain and convolution in the frequency domain. d A pulse in the time domain and its corresponding spectrum. e The sampling result obtained in practice, in which case the periodic sequence of impulses (Dirac functions) is replaced with a sequence of pulses of equal width. This process is also known as PAM. This result is derived through the convolution of c and d in the time domain and multiplication in the frequency domain. f The result of PWM—derived from e in the time domain based on the area equivalence principle.

