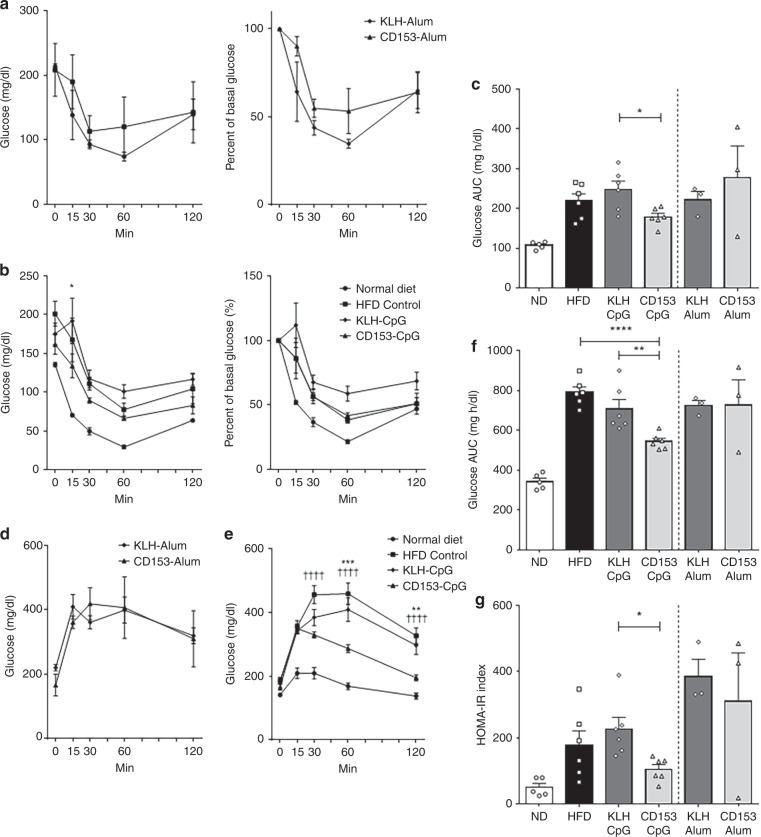
Fig. 3. Glucose tolerance and insulin sensitivity in HFD-loaded mice immunized with CD153 vaccine.
a–c Blood glucose concentrations and percent basal glucose in mice immunized with the Alum-conjugated vaccine (CD153-Alum or KLH-Alum) (a; n = 3 in each group) or the CpG-conjugated vaccine (CD153-CpG or KLH-CpG) (b; n = 6 in each group) as determined by the intraperitoneal insulin tolerance test (ipITT). Mice in both the ND (normal diet, n = 5) and HFD (high-fat diet, n = 6) control groups were treated in a manner similar to the vaccinated group. Asterisk indicates the CD153-CpG group vs. the KLH-CpG group. c Area under the curve (AUC) of blood glucose levels as determined by the ITT. The AUC was estimated using the trapezoidal rule. d–f Blood glucose concentrations in mice immunized with the Alum-conjugated vaccine (d; n = 3 in each group) or the CpG-conjugated vaccine (e; n = 6 in each group) as determined by the oral glucose tolerance test (OGTT). Mice in both the ND (normal diet, n = 5) and HFD (high-fat diet, n = 6) control groups were treated in a manner similar to the vaccinated group. Asterisk indicates the CD153-CpG group vs. the KLH-CpG group. Dagger indicates the CD153-CpG group vs. the HFD control group. f AUC of blood glucose levels as determined by the OGTT. The AUC was estimated using the trapezoidal rule. g HOMA-IR index after 6 h of fasting. Alum-conjugated vaccine group, n = 3 in each group; CpG-conjugated vaccine group, n = 6 in each group; ND control group, n = 5; HFD control group, n = 6. All the data are expressed as the mean ± SEM. Statistical evaluation was performed by two sided; unpaired two-tailed t-test, KLH-Alum vs. CD153-Alum (c, f, g); Bonferroni correction, HFD vs. KLH-CpG vs. CD153-CpG (C, F and G); Tukey’s multiple comparison test (a, b, d, e); *p < 0.05; **p < 0.01; ***p < 0.001; ****p < 0.0001; ††††p < 0.0001.

