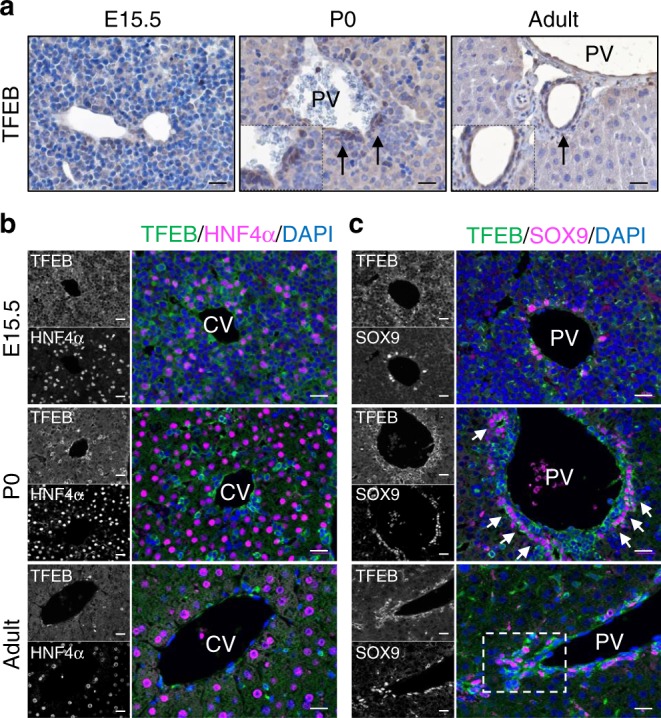
Fig. 1. TFEB expression is enriched in ductal/progenitor cells.

a Immunohistochemistry analysis of TFEB in wild-type (WT) liver at the indicated stages showing prominent signaling in bile ductules. Arrows indicate ductal cells. b, c Representative immunofluorescence stains for TFEB/HNF4α (b) and TFEB/SOX9 (c) showing TFEB levels in the central (CV) and in the portal (PV) vein area. Scale bar 20 μm. Micrographs are representative of five mice of each stage.
