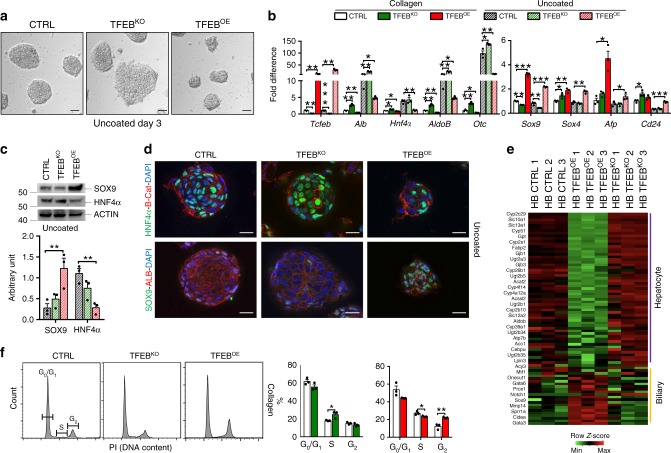
Fig. 2. TFEB influences hepatoblast differentiation in vitro.
a Hepatocyte sphere formation of HBs of the indicated genotypes 3 days after differentiation. Scale bar 20 μm. Micrographs are representative of three independent experiments. b mRNA levels of the indicated genes were quantified by quantitative RT-PCR of total RNA isolated from control (CTRL), TFEB-overexpressing (TFEBOE), and TFEB depleted (TFEBKO) HBs undifferentiated (collagen-coated plates) or after 5 days of hepatocyte differentiation (uncoated plates). Values are indicated as mean ± SEM of n = 3 biological replicates and expressed as fold difference compared with CTRL undifferentiated HBs. c Immunoblotting analysis and relative quantification of the precursor/cholangiocyte marker SOX9 and the hepatocyte marker HNF4α in TFEBKO and TFEBOE HBs after 5 days of hepatocytic differentiation (n = 3 biological replicates). d Immunostaining for the indicated markers on TFEBKO and TFEBOE HBs 5 days after hepatocytic differentiation. Scale bar 5 μm. Micrographs are representative of three independent experiments. e Gene expression profiling of hepatocyte and biliary genes of differentiated HBs of the indicated genotypes. f Flow cytometry analysis of the cell cycle distribution of undifferentiated CTRL, TFEBKO and TFEBOE HBs and relative quantification (n = 3 biological replicates). Source data are provided in the Supplementary Fig. 10. Data are represented as mean ± SEM. *p ≤ 0.05, **p ≤ 0.01, ***p ≤ 0.001 two-tailed Student’s t-test. Source data are provided as a Source Data file.

