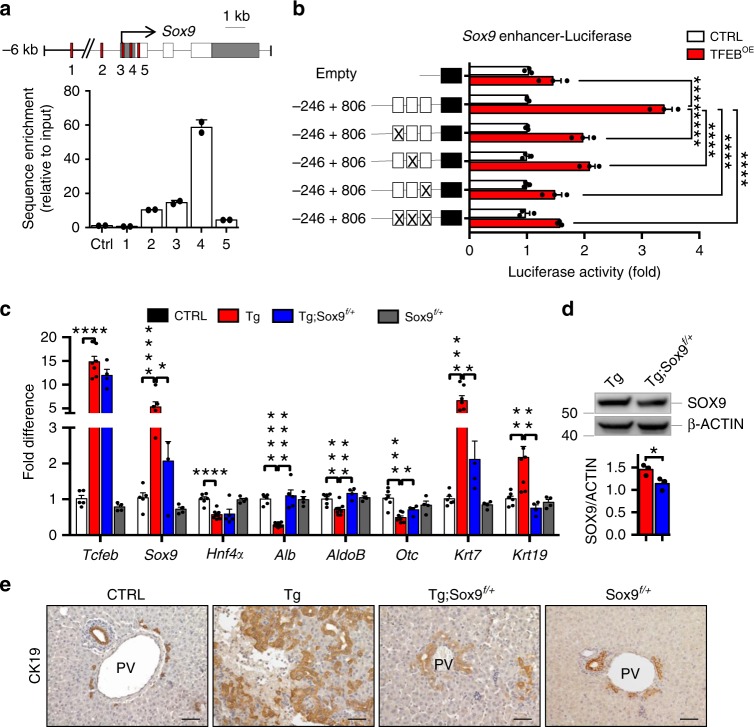
Fig. 4. TFEB directly controls Sox9 expression.
a ChIP analysis of TFEB binding to the Sox9 promoter in Tg livers. CLEAR sites in the promoter region of Sox9 are indicated by red squares. Bar graphs show the amount of immuno-precipitated DNA as detected by RT-PCR analysis. Values are representative of two independent experiments. Data were normalized to the input and plotted as relative enrichment over the control sequence. b Luciferase expression upon TFEB overexpression was measured in HBs infected with HDAd-LacZ (CTRL) or HDAd-CRE expressing viruses (TFEBOE) for 24 h and transfected with wild type or mutated Sox9-promoter luciferase reporter plasmids (n = 3 biological replicates). Deletion of the CLEAR sites resulted in reduced luciferase transactivation. Data are represented as mean ± SEM. ****p ≤ 0.0001 two-way ANOVA. c RT-PCR expression analysis of hepatocyte- and cholangiocyte-specific markers in livers isolated from P9 mice for the indicated genotypes (n = 6 CTRL, n = 8 Tg, n = 4 Tg; Sox9f/+, n = 4 Sox9f/+). Data are represented as mean ± SEM. *p ≤ 0.05, **p ≤ 0.01, ***p ≤ 0.001, ****p ≤ 0.0001 two-tailed Student’s t-test. d Representative immunoblot for SOX9 in liver of the indicated genotypes and relative quantification (n = 3 biological replicates). e CK19 immunostaining of liver sections from P9 mice of the indicated genotypes. Scale bar 50 μm. Source data are provided as a Source Data file.

