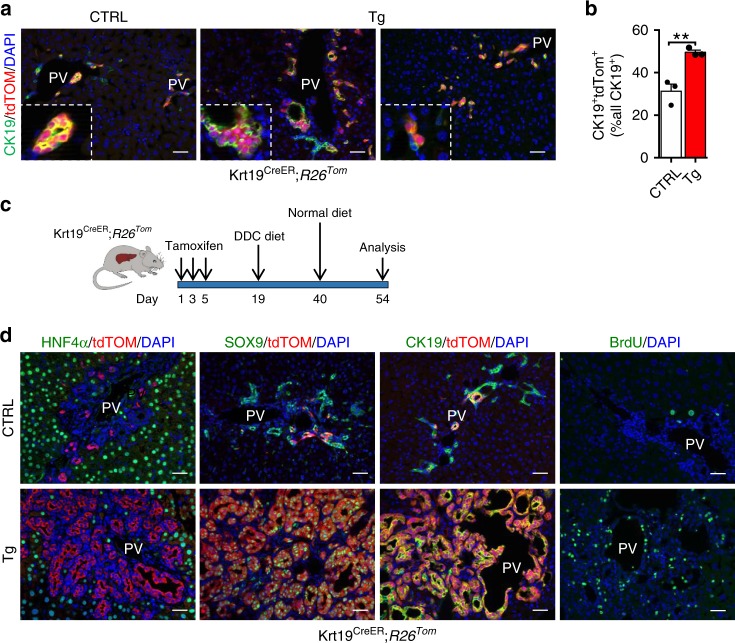
Fig. 6. TFEB overexpression in progenitor/cholangiocytes gives rise to ectopic ductal structures.
a Representative image of CK19/tdTom dual immunofluorescence of CTRL and TFEBOE liver 4-weeks after tamoxifen injection. Scale bar 50 μm. b Quantification of CK19+ biliary epithelial cells that were tdTom+ (n = 3 biological replicates/n = 5 different images/sample). Data are represented as mean ± SEM. **p ≤ 0.01 two-tailed Student’s t-test. c Experimental strategy to lineage trace biliary epithelial cells on a background of liver injury. d tdTom/HNF4α, tdTom/SOX9, and tdTom/CK19 immunofluorescent images at 14 days after DDC diet. Scale bar 50 μm. Source data are provided as a Source Data file.

