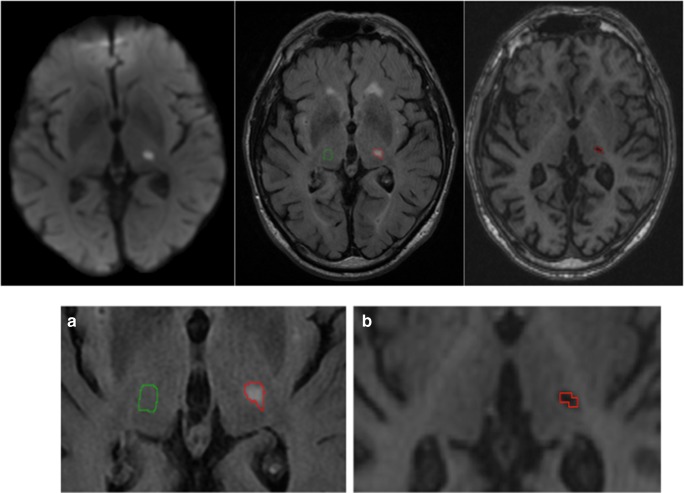
Fig. 3.
Calculation of the RSSI cavitation index. The index RSSI in the thalamus is segmented on FLAIR scans at baseline (outlined in red). The green mask illustrates the contralateral control region (image A). Image B shows the evolution of the RSSI at 1-year follow-up as a cavity on T1. The cavity was again segmented (displayed in red). The cavitation index is calculated as the ratio between the volume of the T1 cavity at 1 year and the FLAIR volume of the RSSI at baseline (= 27% in this case)

