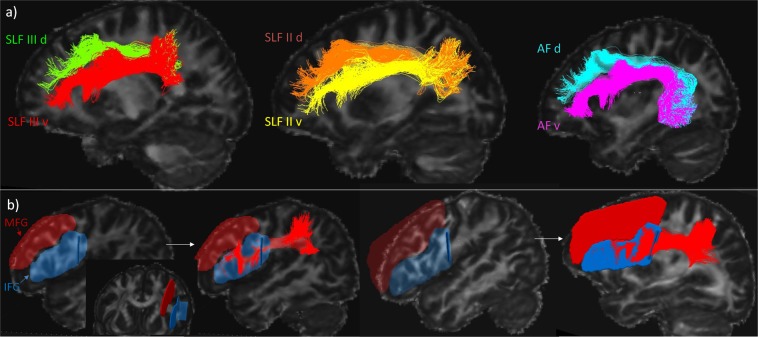
Figure 6.
(a) Example for one participant of the separation of each tract into dorsal (d; connecting with the MFG; green, orange and cyan for the SLF III, SLF II and AF, respectively) and ventral (v; connecting with the IFG; red, yellow and fuchsia for the SLF III, SLF II and AF, respectively) branches. (b) Specifically drawn IFG (blue) and MFG (red) inclusion ROIs for two participants and the example of the ventral SLF III branch linked to the IFG ROI.

