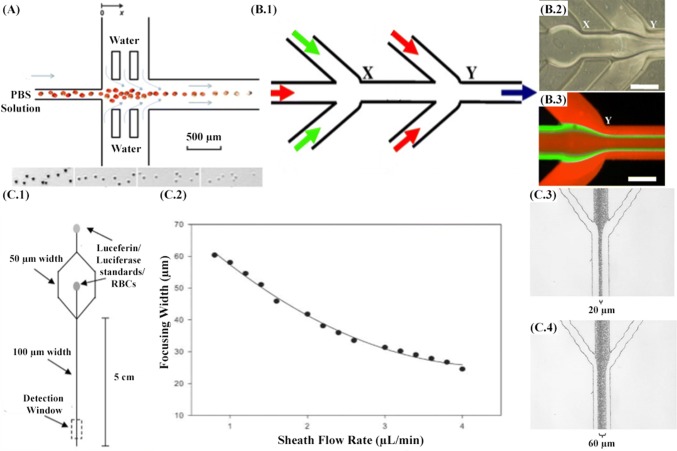
Fig. 5.
A Microfluidic device design showing the osmotic lysis of erythrocytes. The inset images from left to the right show the cell images at various locations (x = 1.5 mm, x = 13.5 mm, x = 22.5 mm, and x = 37.5 mm). Adapted from [92] by permission from the Royal Society of Chemistry. B.1 Schematic of the 5-inlet MF system. B.2 Optical micrograph of the flow pattern at the two junctions (X and Y) of the MF system. B.3 Fluorescence micrograph of flow pattern at junction Y. The volumetric flow rates used for rhodamine, fluorescein, and rhodamine were 200, 20, and 200 µL/min, respectively. The red and green color is rhodamine and fluorescein, respectively. Scale bar = 250 µm. Adapted from [94] by permission from Elsevier. C.1 Microchip design used to deform erythrocytes and detect ATP via chemiluminescent reaction with luciferin/luciferase. C.2 Width of the focused stream as a function of the sheath flow rate. C.3 Micrograph demonstrating a focusing width of approximately 60 mm (cross-sectional area = 3480 sq. mm). C.4 Micrograph demonstrating a focusing width of approximately 20 mm (cross-sectional area = 1160 sq. mm). Adapted from [93] by permission from the Royal Society of Chemistry

