Fig. 6.
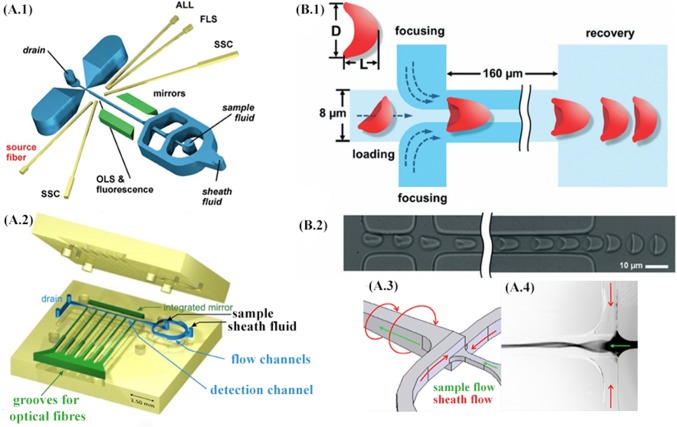
A.1 The layout of the microfluidic prototype chip with cascaded hydrodynamic focusing. Grooves to insert optical fibers are indicated in yellow and integrated mirrors in green color (ALL: axial light loss, FLS: forward light scatter; SSC: side scatter). Fluorescence is measured in parallel to orthogonal light scatter (OLS). Adapted from [95] with permission from Wiley Online Library. A.2 The layout of the microfluidic structure featuring spin hydrodynamic focusing (the top and bottom parts before assembly). The hollow cavities of the microfluidic chip, including flow channels (blue color), integrated mirror, and six grooves to insert optical fibers (green), are “detached” from the body (yellow) to facilitate the overview on the layout. A.3 Operation principle with sheath and sample flow directions. A.4 Fluorescence image (inverted greyscale) of rhodamine dye 6G used as a sample fluid and excited with a mercury arc lamp. Adapted from [96] with permission from the Multidisciplinary Digital Publishing Institute. B.1 Schematic of the microfluidic device for studying deformability changes of stored RBCs. Hydrodynamic focusing centers the cell and adjusts it to the ‘standing’ orientation. The RBC is ‘folded’ into a parachute-like shape when pressure-driven through the 8 μm × 8 μm central channel. Deformation index (DI = L/D) is defined to measure RBC deformation (top-left). The time constant (tc) of each cell is determined by fitting DI value changes during the cell shape recovery process to an exponential function after the cell exits the microchannel. B.2 Experimental images are showing the centering, orienting, folding, and shape recovering of an RBC. Adapted from [99] with permission of the Royal Society of Chemistry. (Color figure online)

