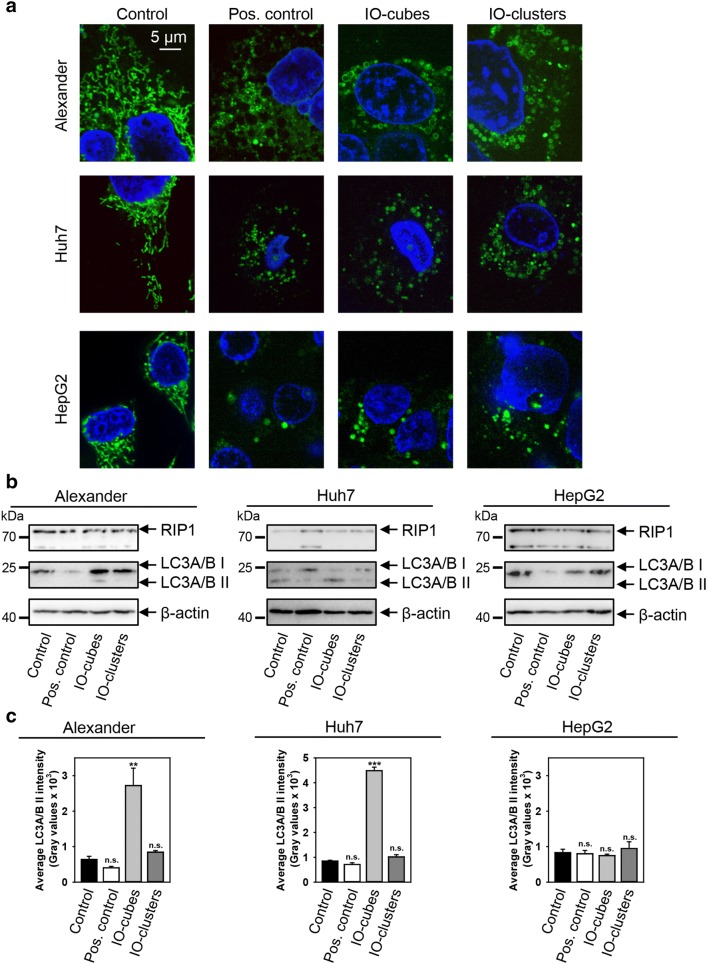
Fig. 5.
a Alteration of mitochondrial morphology by IO-cubes and IO-clusters treatment. Cells were stimulated with IO-cubes or IO-clusters (100 µg/mL) for 24 h and labeled with MitoTracker® green. Treatment with 20% ethanol for 20 min served as a positive control. Nuclei were labelled with hoechst 33342 nuclear stain (blue). Labeled cells were then imaged using high-resolution spinning disk confocal microscopy (Spin SR, Olympus). b Cells were stimulated with IO-cubes or IO-clusters (100 µg/mL) for 24 h and analyzed by Western immunoblotting. Actin-control of equal protein loading. Cells treated with 2 μM staurosporine for 3 h served as a positive control. c Densitometric quantification of membrane-bound lipidated form of LC3. Average band intensity after Western blotting (b). Cells were treated as in b. Data are expressed as mean ± SEM (n = 3), ***p < 0.001, **p < 0.01

