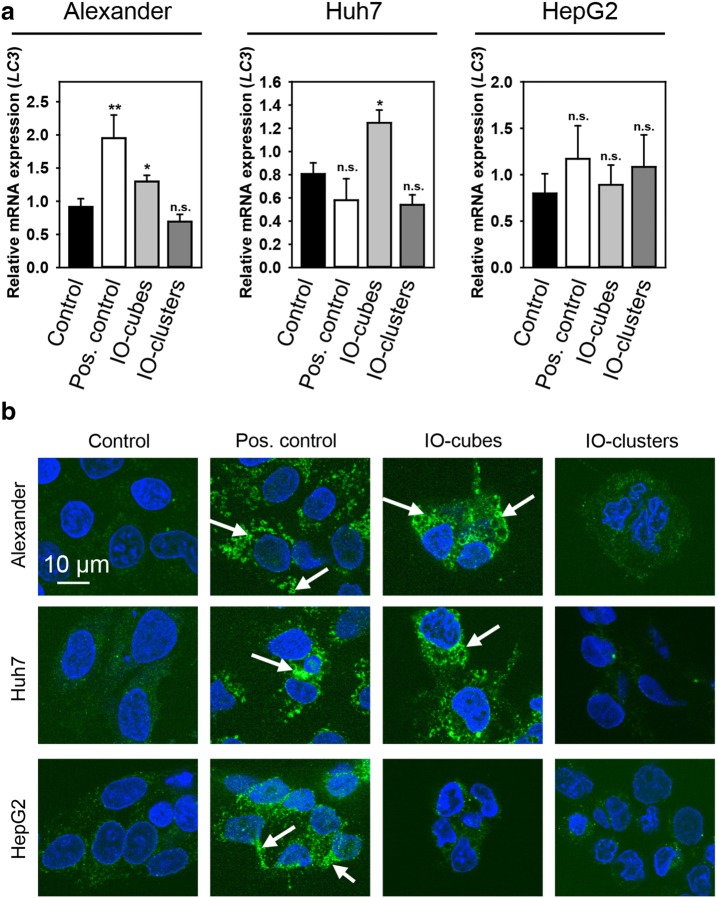
Fig. 6.
Monitoring autophagy in cells stimulated with IO-cubes or IO-clusters. a Cells were stimulated with IO-cubes or IO-clusters (100 µg/mL) for 24 h The relative gene expression was normalized to GAPDH expression, and calculated using the 2−ΔΔCT method. Cells treated with 2 μM staurosporine for 3 h served as a positive control. Results are mean ± SEM, **p < 0.01, *p < 0.05. b Formation of LC3-positive puncta upon nanoparticle treatment. Cells were stimulated with IO-cubes or IO-clusters (100 µg/mL) for 24 h, fixed, permeabilized and labeled with LC3A/B (green). Nuclei were labelled with hoechst 33342 nuclear stain (blue). Labeled cells were then imaged using high-resolution spinning disk confocal microscopy (Spin SR, Olympus). White arrows indicate accumulation of autophagosomes. Positive control—serum starvation for 12 (Alexander, Huh7) and 14 (HepG2) h

