Fig. 7.
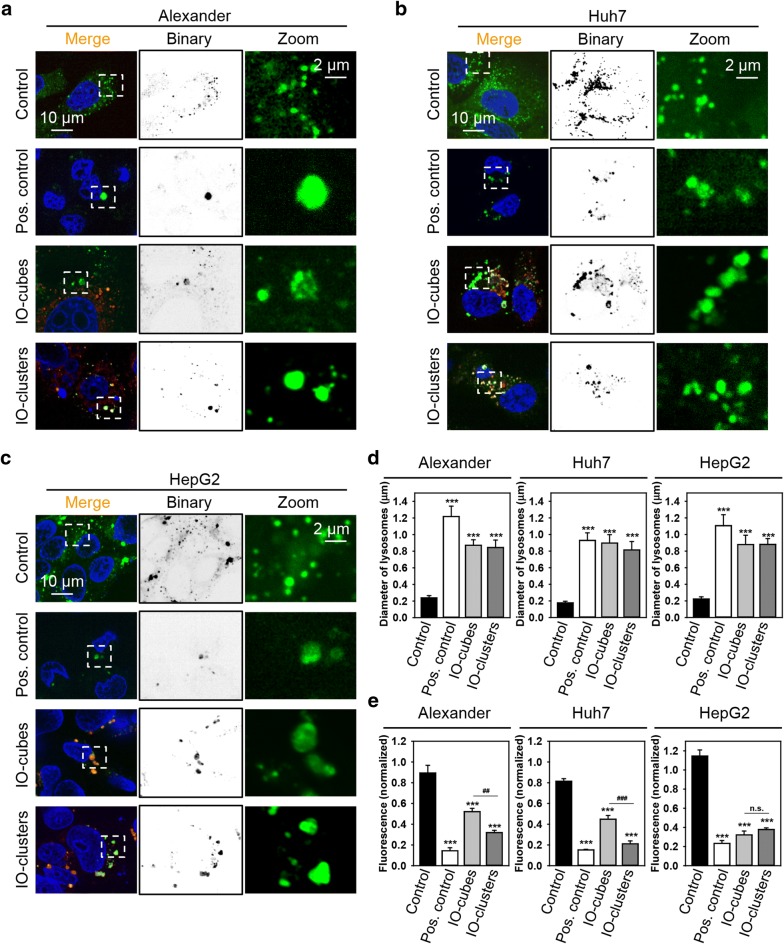
IO-cubes and IO-clusters treatment affects lysosomal integrity. Alexander (a), HepG2 (b) and Huh7 (c) cells were treated with fluorescently labeled (red) IO-cubes or IO-clusters (100 µg/mL) for 24 h and stained with LysoTracker (green), yellow indicates colocalization of fluorescently labeled nanoparticles with lysosomes. Positive control—20% ethanol for 20 min. Nuclei were labelled with hoechst 33342 nuclear stain (blue). Labeled cells were then imaged using high-resolution spinning disk confocal microscopy (Spin SR, Olympus). d Assessment of the lysosomal size upon IO-cubes or IO-clusters (100 µg/mL) uptake. Labeled cells were then imaged by confocal microscopy as in a–c, and images were quantified using ImageJ software (NIH). Quantifications performed using ImageJ are presented as means of n = 15 cells. ***p < 0.001 denote significant differences respect to control (no particle treatment). Positive control—20% ethanol for 20 min. e Alexander, HepG2 and Huh7 cells were exposed to IO-cubes or IO-clusters (100 µg/mL), then stained with LysoTracker and analyzed by laser scanning confocal microscopy, as described in a–c. Fluorescence intensities were analyzed with ImageJ (NIH). Data are expressed as mean ± SEM (n = 3), ***p < 0.001, ##p < 0.01, ###p < 0.001. As a positive control, cells were treated with 20% ethanol for 20 min

