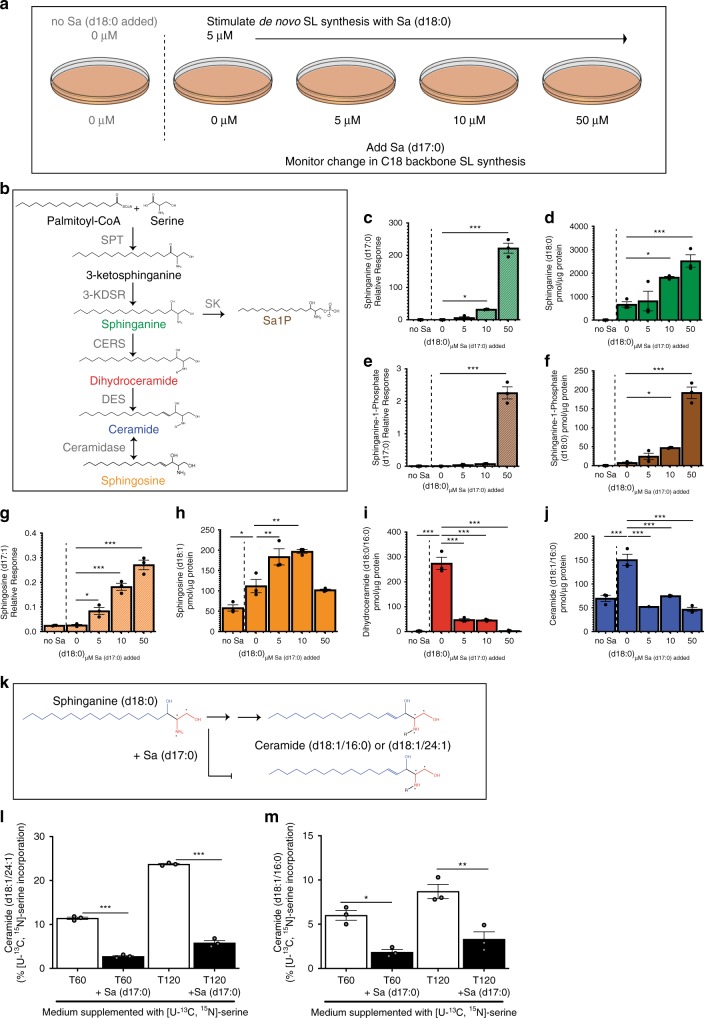
Fig. 1. Odd chain SLs produced by gut microbes can inhibit host de novo synthesis of even chain SLs.
a Illustration of experimental setup where Caco-2 cells were stimulated with 5 μM of Sa (d18:0) and challenged with increasing concentrations of Sa (d17:0). b SL de novo synthesis pathway. SPT (serine palmitoyltransferase), 3-KDSR (3-keto-dihydrosphignosine reductase), CERS (ceramide synthase), DES (desaturase), SK (sphingosine kinase). c–j SL synthesis was induced in proliferating Caco-2 cells with addition of 5 μM Sa (d18:0), then cells were dosed with increasing concentrations (5, 10, 50 μM) of Sa (d17:0) to monitor the ability of Sa (d17:0) to inhibit flux of C18-base length SLs through the SL synthesis pathway. Labels and graph colors refer back to the corresponding metabolite in (b); graphs of metabolites with C18 sphingoid backbones have solid bars while graphs of metabolites with C17 sphingoid backbones are represented by striped bars. Cells were harvested 1 h after addition of lipids. Means ± standard error of the mean (SEM) of three biological replicate experiments (n = 3) (one-way ANOVA comparing concentrations to 0 μM Sa (d17:0) added, *p < 0.05, **p < 0.01, ***p < 0.001), are plotted for (c) Sa (d17:0), (d) Sa (d18:0), (e) sphinganine-1-phosphate (Sa1P) (d17:0), (f) Sa1P (d18:0), (g) So (d17:1), and (h) So (d18:1) (i) dihydroceramide (d18:0/16:0), (j) ceramide (d18:1/16:0). c–j, k Diagram of incorporation of [U–13C,15N]-serine (red) to identify newly synthesized SLs. [U–13C,15N]-serine was added to culture medium and [M + 3] isotopes due to [U–13C,15N]-serine incorporation into newly synthesized SLs were monitored by LC-MS. Sa (d17:0) was added to determine if this metabolite decreased the de novo synthesis of SLs with a C18 length sphingoid base. Percent incorporation of [U–13C,15N]-serine was measured for (l) ceramide (d18:1/16:0) and (m) ceramide (d18:1/24:1) after 60 (T60) and 120 min from the addition of the [U–13C,15N]-serine. Bars represent the mean ± SEM of three biological replicates (two-sided t-test, *p < 0.05, **p < 0.01, ***p < 0.001). Source data are provided as a source data file. For all figures with bars, height of bar = mean and error bar is SEM.

