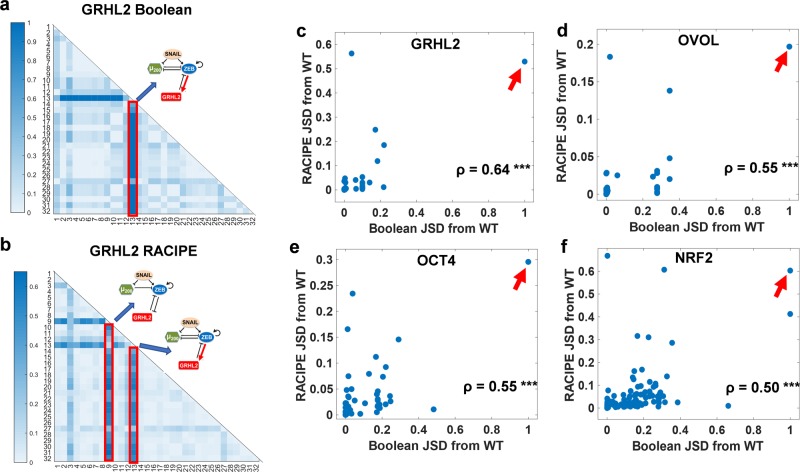
Fig. 3. Quantifying the effect of single-edge perturbations on network behaviour landscapes.
a, b Heatmap of the JSD between steady state distributions of all perturbations for the GRHL2 network from each other, obtained from a Boolean and b RACIPE. Color bar shows the value of JSD. Each number (1–32) represents a particular perturbed network except for number 2, which represents “wild-type” (Table S1). The perturbation highlighted in red has highest JSD from WT and most other perturbations. c–f Scatter plots of JSD between the steady state distributions of a perturbed network from WT as obtained via RACIPE vs. as obtained via Boolean. Each dot in a plot represents a perturbed topology for the EMP networks—c GRHL2, d OVOL, e OCT4, and f NRF2. The strongest perturbation identified by both Boolean and RACIPE is highlighted by the arrow. Spearman correlation coefficients (ρ) are reported; ***p < 0.001.

