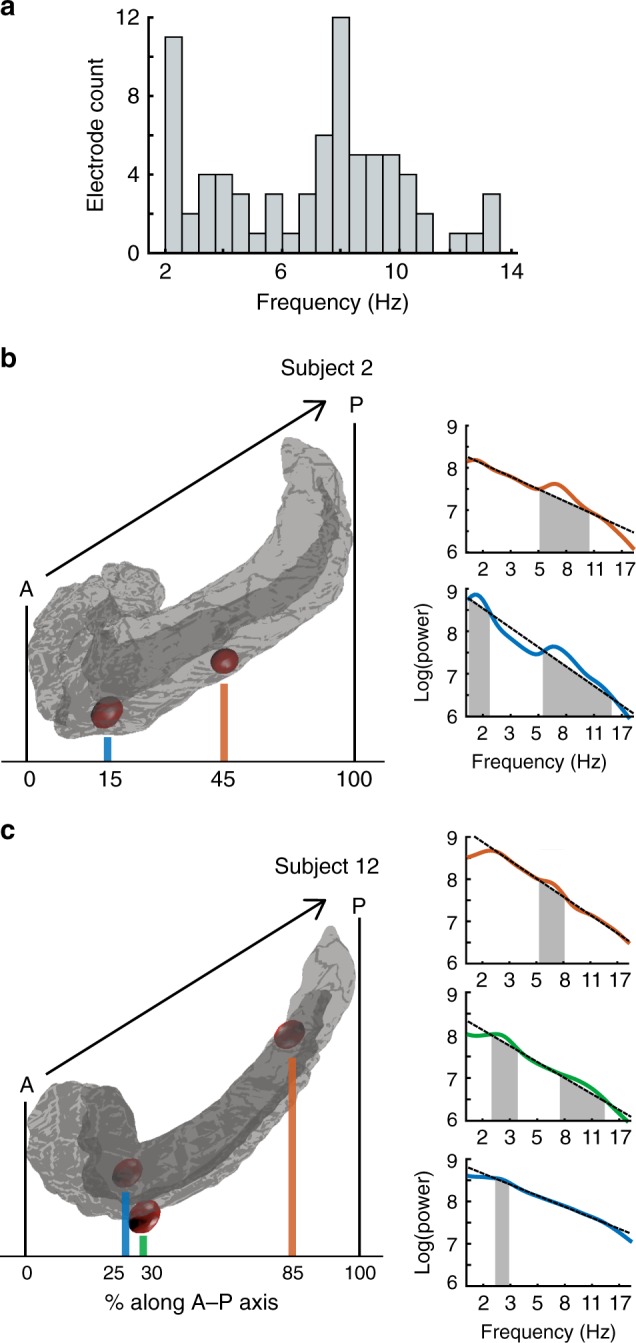
Fig. 2. Power spectra of electrodes along the anterior–posterior axis of the hippocampus.

a The distribution of detected oscillations across all hippocampal electrodes in our data set. b Rendering of Subject 2’s left hippocampus (left) and the power spectra (right) for electrodes implanted in this area. Shading in the power spectrum indicates detected narrowband oscillations. c Rendering of Subject 12’s left hippocampus and power spectra for the implanted electrodes.
