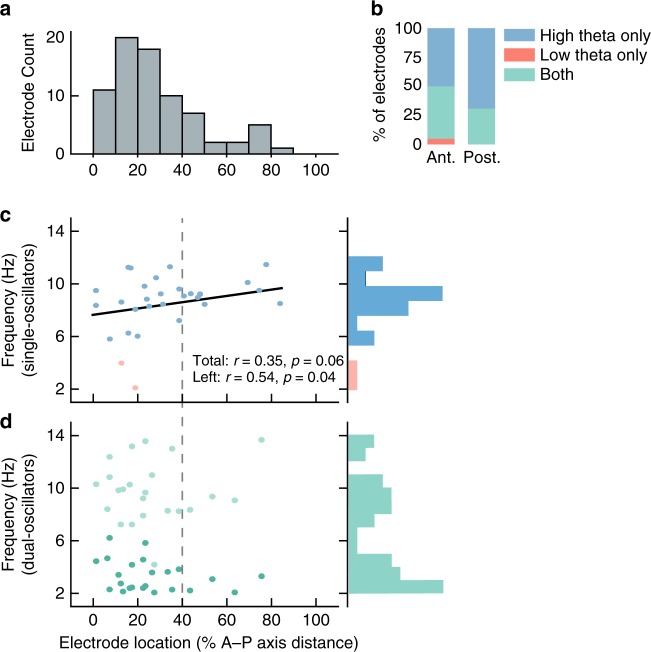
Fig. 3. Oscillation properties across frequency and space.
a Distribution of electrode locations along the hippocampus anterior–posterior (AP) axis. b Proportions of dual oscillators and single oscillators for anterior and posterior hippocampus. Source data are provided as a Source Data file. c Frequencies and hippocampal localizations of single oscillators across subjects. Black line indicates the fit between frequency and AP position for all high-theta electrodes in both hippocampi. Pearson r correlations between electrode location and frequency are reported for both hippocampi and for the left hippocampus alone. Gray dotted line indicates the split between anterior and posterior hippocampus. d Frequency and localization of dual oscillators. Dark green represents the slower oscillation.

